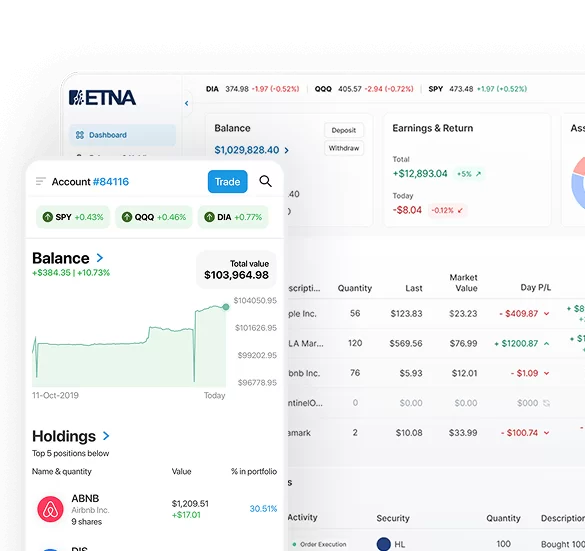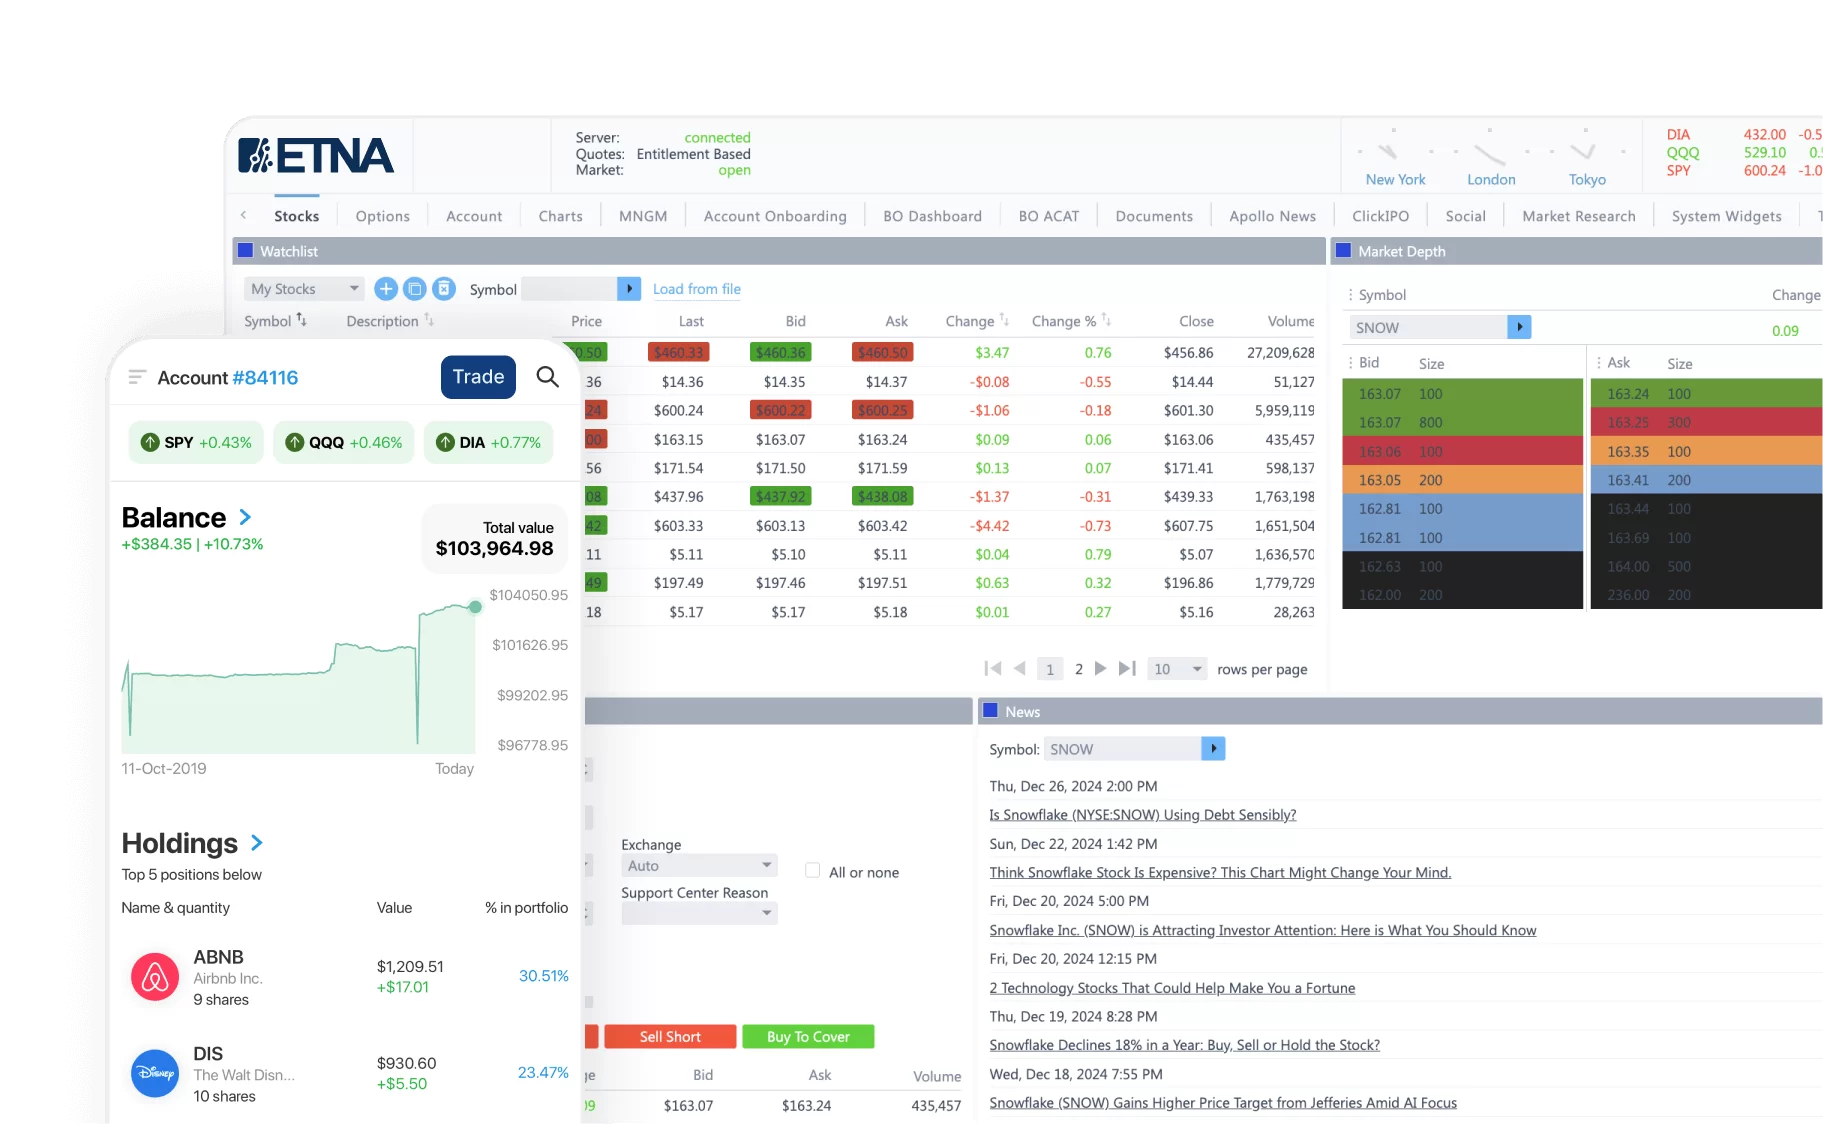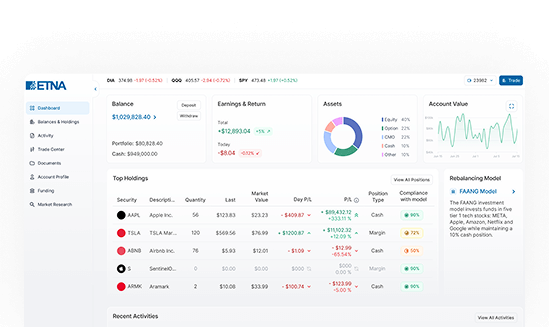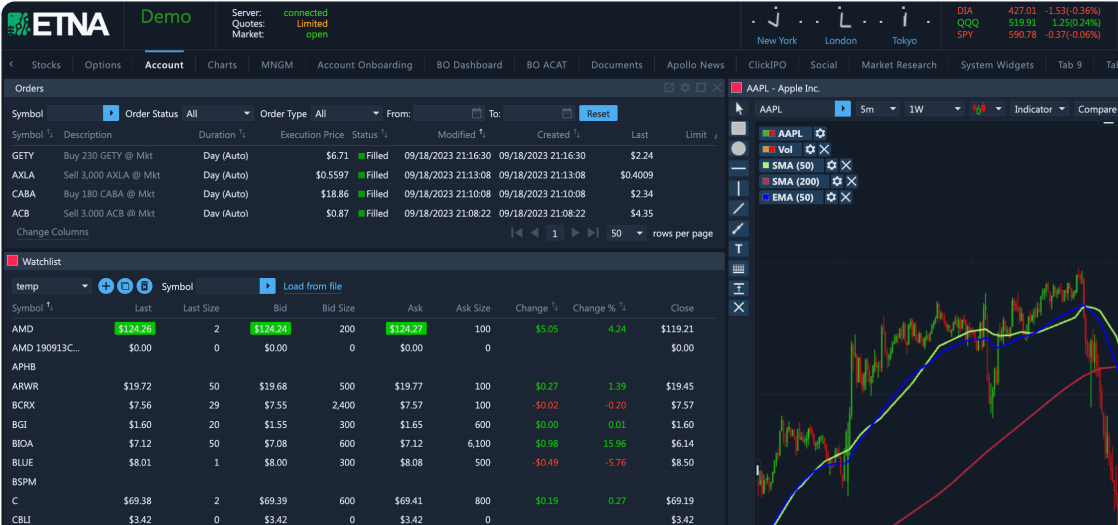
Software
for trading
and wealth
management
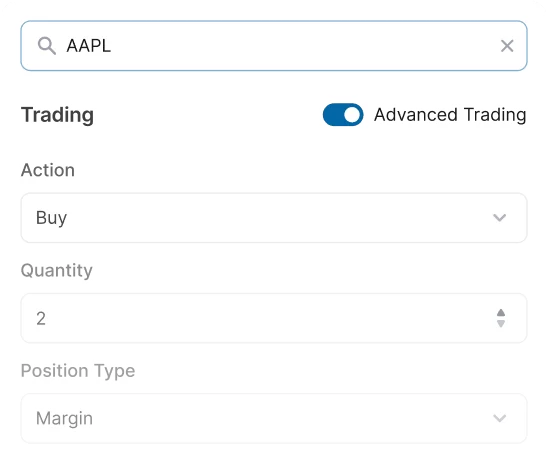
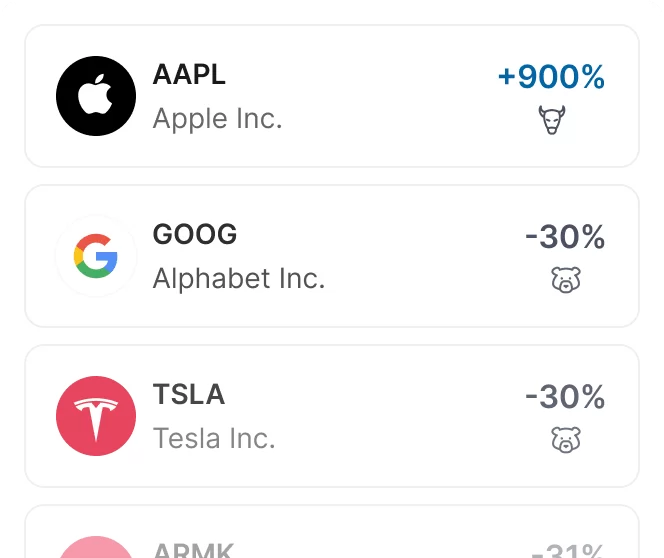
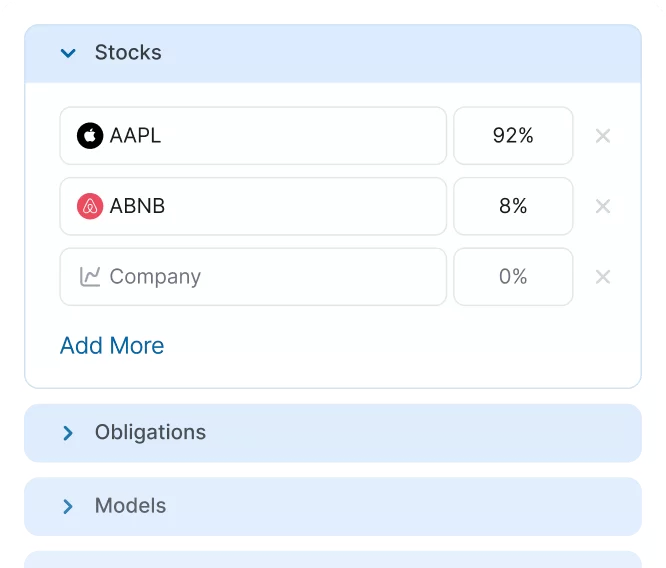
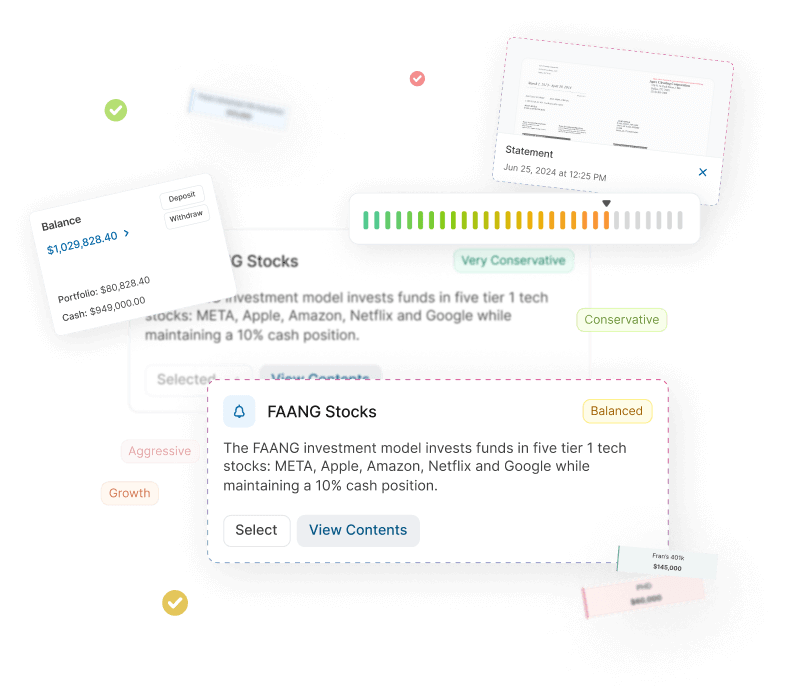
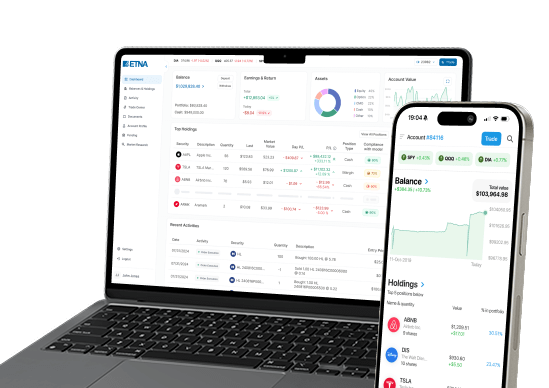
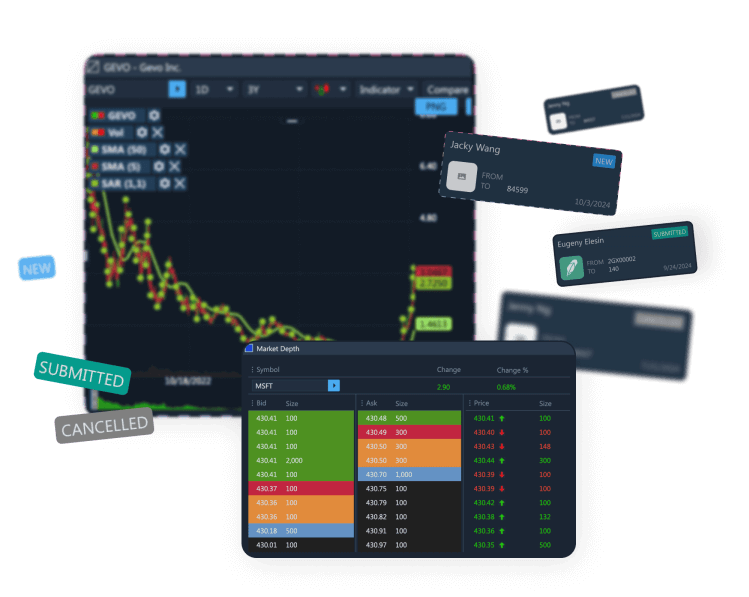
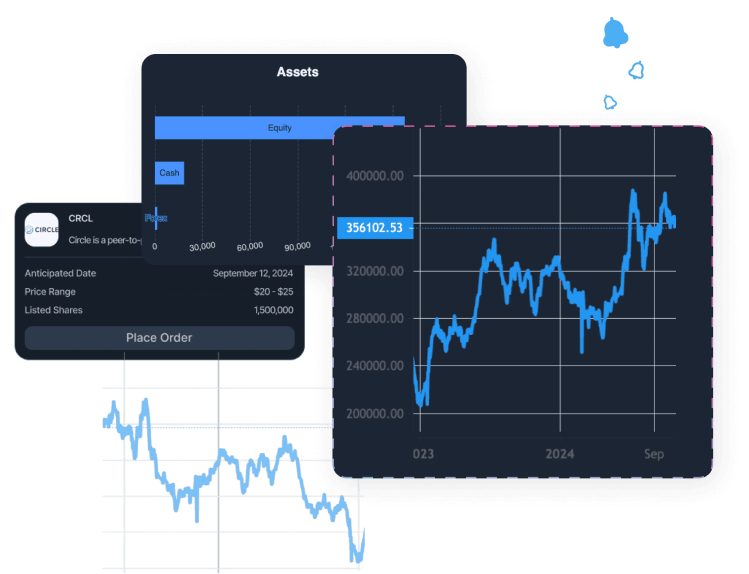
Discover ETNA – a family of fintech products for broker-dealers and RIAs. Combine platforms with apps, APIs, and tools for trading, client management, and portfolio growth.
White-label solution for: