28.08.2025

Modern trading success hinges on the ability to interpret market data quickly and accurately, making charting tools essential for traders at every stage. Whether you’re just getting started or refining your approach, mastering chart analysis can dramatically boost your odds of making profitable trades. Let’s explore the core techniques, industry stats, practical scenarios, and how the ETNA White Label Trading Platform equips traders for charting success.
Trading is no longer the exclusive domain of a select few. Today, platforms like TradingView boast over 90 million users, and even beginners have access to sophisticated, institutional-grade tools. Charting tools aren’t just for seasoned professionals they’re a necessity for understanding patterns and seizing opportunities.
Why do traders trust technical analysis?
Key insight: Leveraging charting platforms is no longer optional for consistent results it’s the standard for data-driven trading.
Japanese candlestick charts provide the most comprehensive price information in a visually intuitive format. Each candlestick displays four critical data points: open, high, low, and close prices for a specific time period. The visual nature of candlesticks allows traders to quickly identify market sentiment, momentum shifts, and potential reversal points.
Recent studies analyzing 40 years of candlestick pattern data found that certain formations maintained success rates around 70% during the 1980s, though these rates have evolved with changing market conditions. The key to effective candlestick analysis lies in understanding that patterns work best when combined with other confirmation signals.
Line charts excel at revealing long-term trends and major support/resistance levels without the visual noise of individual price fluctuations. Professional traders often use line charts for higher timeframe analysis while switching to candlestick charts for precise entry and exit timing.
OHLC (Open-High-Low-Close) bar charts provide the same information as candlesticks in a different visual format. Some traders prefer bar charts for specific technical analysis techniques or when analyzing multiple timeframes simultaneously.
Moving averages represent the most fundamental and widely used technical indicators, with Simple Moving Averages (SMA) achieving a 28.6% win rate and Exponential Moving Averages (EMA) reaching 30.7% according to comprehensive historical analysis. While these numbers might seem low, moving averages serve as trend filters rather than standalone trading signals.
Professional tip: Combine moving averages with volume analysis to improve signal reliability by 17%.
The Relative Strength Index (RSI) emerges as the most reliable single indicator with its 79.4% win rate. RSI measures momentum on a 0-100 scale, with readings above 70 indicating overbought conditions and readings below 30 suggesting oversold levels.
Moving Average Convergence Divergence (MACD) provides trend following and momentum analysis in one indicator. Despite a 40.1% standalone win rate, MACD becomes significantly more powerful when combined with other indicators. MACD + RSI combinations reduce false signals by 65%.
Bollinger Bands achieve a 77.8% win rate, making them the second-most reliable indicator. These bands expand and contract with volatility, providing dynamic support and resistance levels while indicating overbought/oversold conditions and potential breakout scenarios.
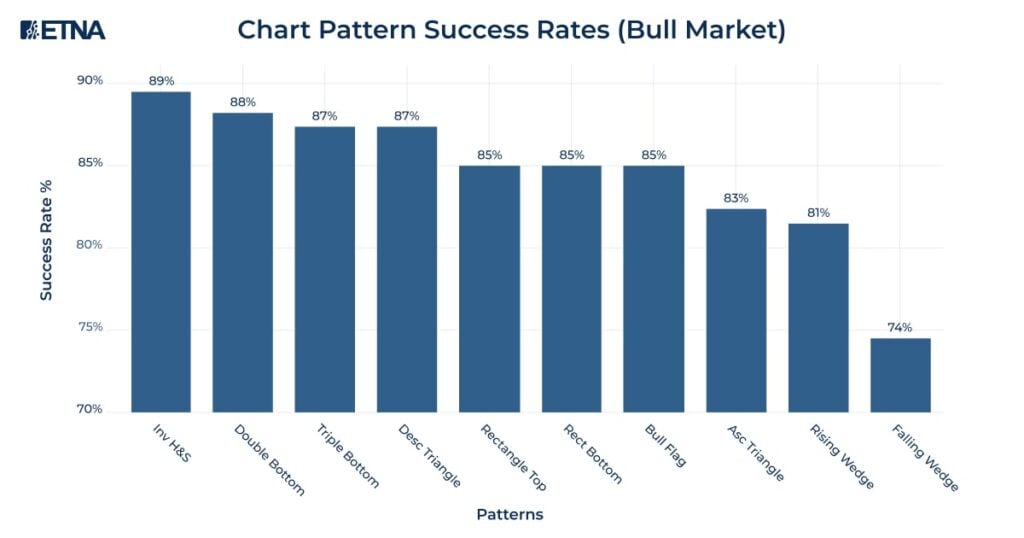
Head and Shoulders patterns represent classic reversal formations with 83% average success rate. These patterns indicate exhaustion in the current trend and often precede significant directional changes. Volume confirmation significantly improves pattern reliability, as genuine reversals typically coincide with increased trading activity.
Double Top and Double Bottom patterns achieve 72% reliability and offer clear entry points, stop-loss levels, and profit targets. These formations indicate that the market has tested key levels twice and failed to break through, suggesting trend reversal probability.
Flag and pennant patterns show 83% continuation probability, making them excellent tools for trending markets. These patterns represent brief consolidations within strong trends, often providing low-risk entry opportunities with favorable risk-reward ratios.
Triangle patterns (ascending, descending, and symmetrical) offer versatility across different market conditions. Ascending triangles achieve 83% success rates with average gains of 43%, while descending triangles show 87% reliability.
Practical Scenario #1: Trend Identification
Practical Scenario #2: Mean Reversion
Practical Scenario #3: Breakout Trading
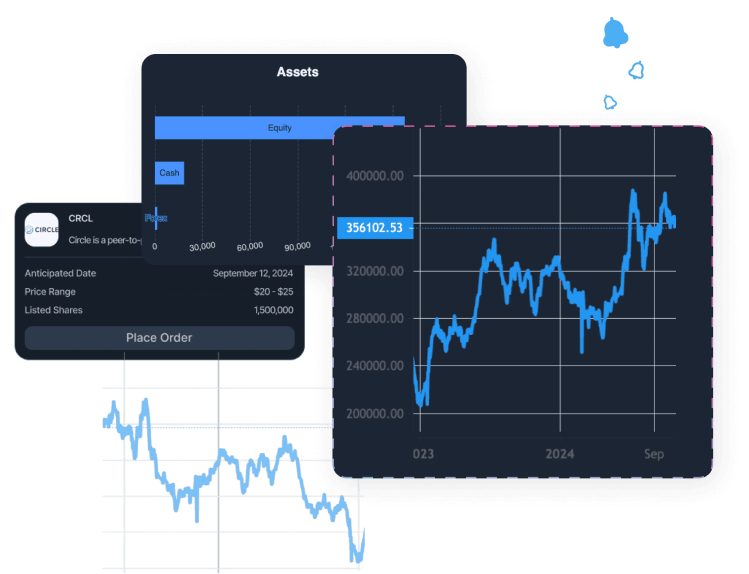
ETNA White Label Trading Platform offers a robust, professional-grade charting solution designed for both beginning and advanced traders:
Mastering charting tools isn’t about chasing the latest “hot” indicator it’s about understanding the foundational patterns, using practical scenarios, and leveraging advanced technology to develop a disciplined edge. The ETNA White Label Trading Platform puts institutional-grade charting, risk, and execution tools at your fingertips, empowering traders at all levels to make sharper, faster, and more informed decisions.
Start by learning the basics, then use powerful, integrated platforms like ETNA to translate analysis into action and watch your trading results grow.

Demo Financial Advisor Software
Manage portfolios with advanced rebalancing and real-time insights.
Access customizable client reports and streamlined compliance tools.
Designed for advisors seeking efficient client and portfolio management.


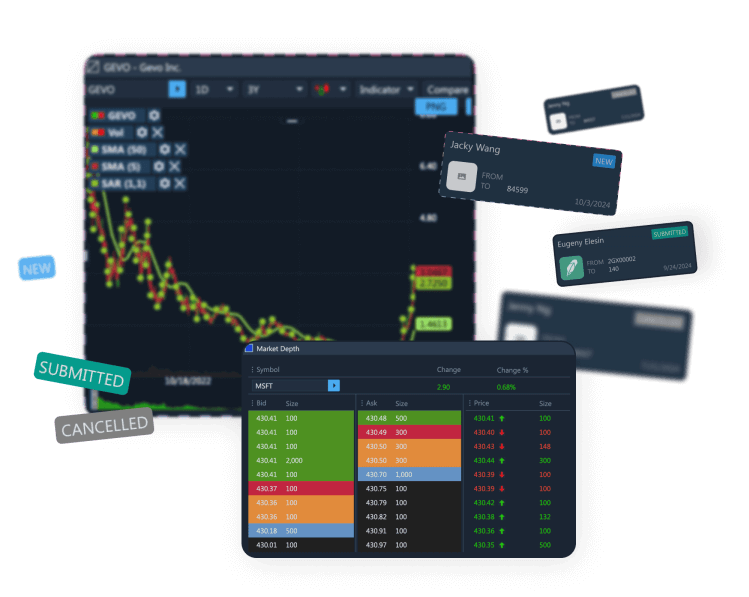
Demo Advanced Trading Platform
Test multi-asset strategies with real-time and historical data.
Analyze market depth, execute complex options, and algorithmic orders.
Ideal for refining strategies and risk management before live trading.

Demo Paper Trading Platform
Practice trading with virtual funds in real market conditions.
Simulate cash, margin, and day-trader accounts to gain experience.
Perfect for honing skills in a risk-free, customizable environment.