A Deep-Dive Guide with Practical Examples for Brokers & Traders
Understanding how to read stock charts, graphs, and trading platforms is the cornerstone of successful active investing. This guide, backed by industry research and practical visuals, covers not just the basics but also modern, AI-powered tools and chart-reading best practices relevant in today’s algorithmic and volatile markets.
Why Chart Reading Matters
Visualizes all price behavior (trend, reversal, trendless, volatility).
Allows early detection of market reversals and breakouts.
Essential for both discretionary traders and those deploying algorithms/AI (over 70-89% of trades now automated).
Human insight helps adapt to news, regime changes, or unprecedented events faster than algorithms alone.
Chart Types & Platforms: A Visual Overview
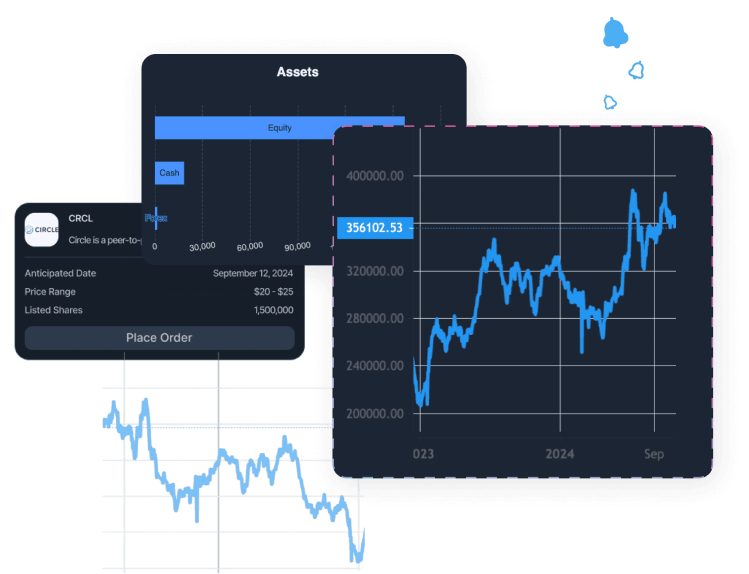
Line Chart
Plots closing price over selected intervals best for “big-picture” trend analysis.
Fast, clean, but lacks detail about intraday price moves and volatility.
Commonly used for comparing long-term stock performance (e.g., two stocks over 5 years).
Bar Chart (OHLC)
Each bar displays opening, high, low, and closing prices for each time period.
Bar height shows volatility; wider bars reflect bigger swings.
Useful for evaluating daily reversals, trend strength, or volatility spikes.
Candlestick Chart
A candlestick chart illustrating price movements with red and green bars on a grid background for stock market analysis.
The global trading and technical analysis standard.
“Body” shows open and close; wicks show high/low; color depicts up (green) or down (red).
Rapid pattern recognition: engulfing, doji, hammer, etc. especially powerful on daily or hourly charts.
Example illustration:
Use colored line or “range bar” charts to visually enhance volatility periods and rapid swings.
Platforms like ETNA offer flexible chart options, timeframes, dark mode, overlays for moving averages, RSI, MACD, and multi-asset viewing.
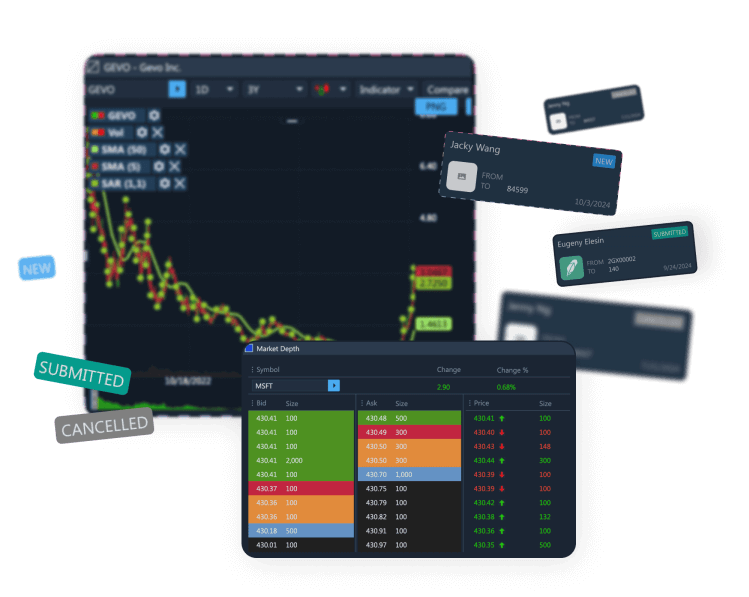
Depth/Order Book/Other Specialized Charts
Depth charts (and price ladders) reveal live market liquidity, order flow, and support-resistance buildups especially in active day trading.
Range bars, Renko bricks, and colored line segments can make spotting sustained trends easier and filter out market “noise”.
Chart Patterns and Trend Signals
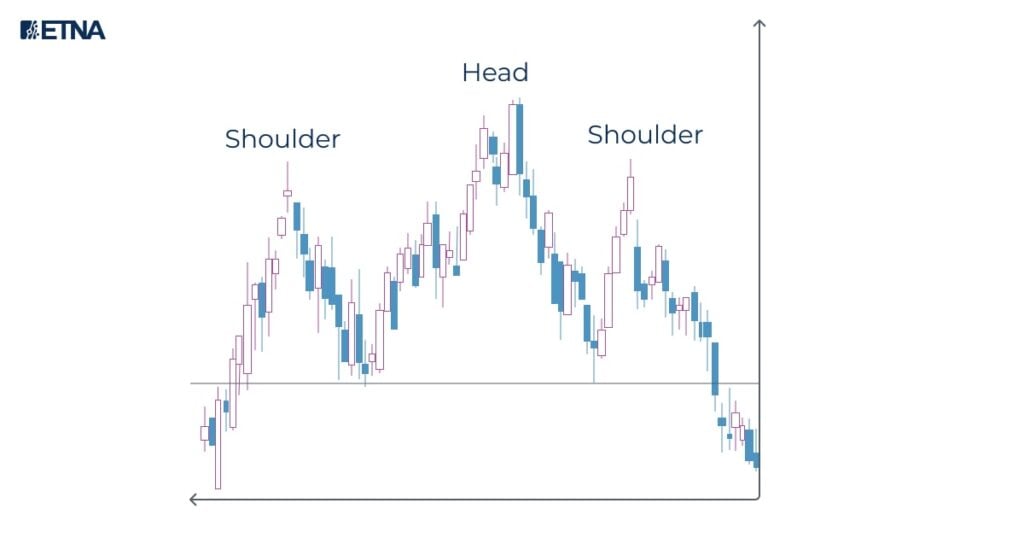
Reversal Patterns
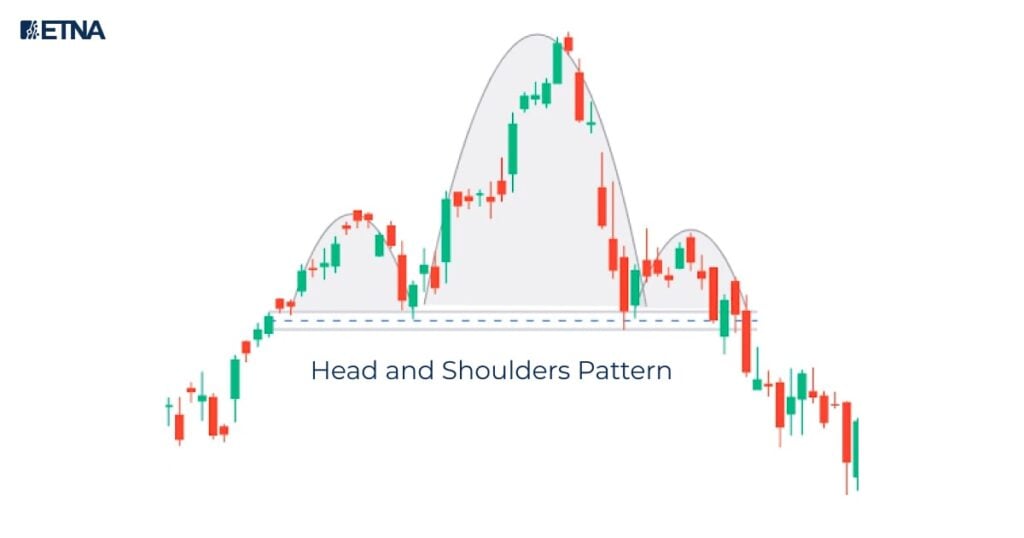
Head & Shoulders: Bearish signal at market tops; high reliability; trigger is break of neckline support.
Inverse Head & Shoulders: Bullish; found at major bottoms; signals trend reversal to the upside.
Double/Triple Top/Bottom: Powerful for short- to medium-term reversal entries; success rates up to 81%.
Key statistics:
Head & Shoulders: ~83% success
Inverse H&S: 83-90%
Double Bottom: 78-81%
Cup & Handle: up to 95%, but requires patience for proper handle formation.
Continuation Patterns
Flags and Pennants: Brief corrections before trend resumes. Flags have parallel boundaries; pennants are more triangular.
Triangles (Ascending, Descending, Symmetrical): Show price “compression” breakouts indicate large moves are coming.
Cup & Handle: Rounded base, slight pullback (handle), then breakout. Highly reliable bull pattern.
Illustrated pattern examples:
Support/Resistance interaction in action
Support/Resistance lines marked on a live chart
Pattern Confirmation:
Always confirm with volume: breakouts with abnormally high trading volume are most trustworthy.
Use multi-timeframe view ideal patterns show alignment on several chart periods for the strongest signals.
Best Technical Indicators & How to Use Them
Moving Averages (SMA/EMA)
Smooth out the price to help track the trend.
Popular: 50-day (medium-term sentiment), 200-day (institutional “line in sand”).
Crossovers (shorter average crossing above/below long average) can generate entries and exits.
RSI (Relative Strength Index)
Measures overbought (>70) or oversold (<30) conditions.
Monitor divergence between price and RSI, especially after big rallies or selloffs.
Effective for timing reversals and avoiding “chasing” extended trends.
MACD (Moving Average Convergence Divergence)
Combines moving averages to reveal momentum, trend strength, and crossovers for buy/sell triggers.
Histogram shows increasing/decreasing momentum great for confirming reversals or trend acceleration.
Bollinger Bands
Plots upper/lower bands a set number of standard deviations from a moving average.
Relative Value (RV), Relative Safety (RS), and Relative Timing (RT) as used by leading platforms offer tailored momentum and risk analytics above/below average.
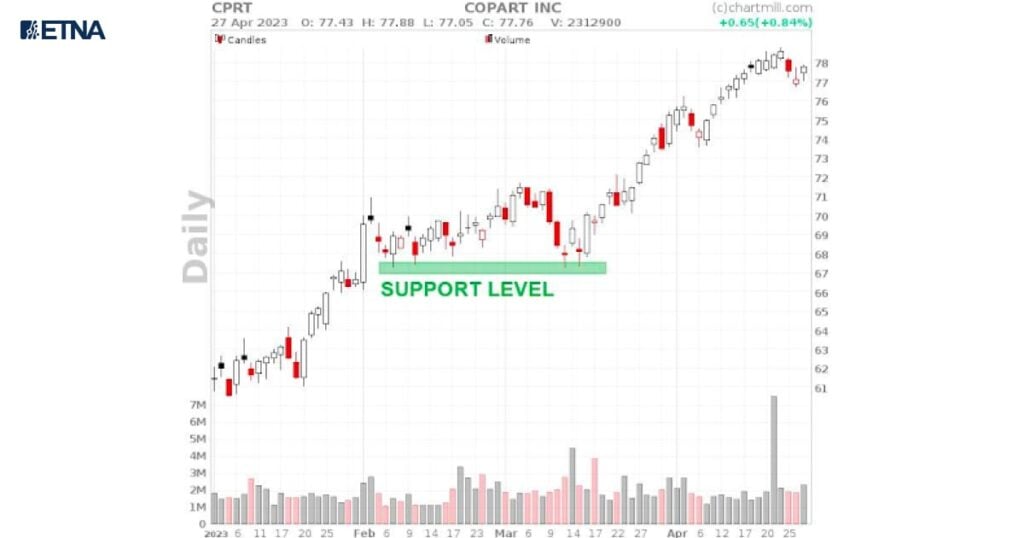
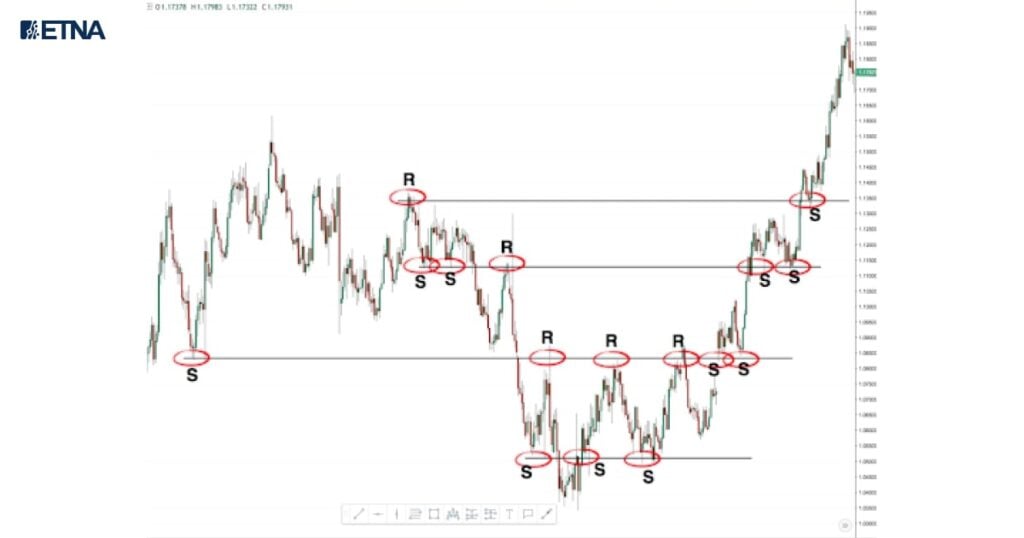
Support, Resistance, and Volume Analysis
Daily candlestick chart illustrating a clear support level for Copart Inc.’s stock price in early 2023.
Support: Price “floor” multiple bounces signal strength. Can be a moving average or a horizontal price region with lots of previous buying.
Resistance: Price “ceiling” where rallies stall historically. Major breakouts above resistance can start powerful new trends.
Order Flow & Depth: Platforms now provide visual order book overlays, making “hidden” orders visible for advanced traders.
Volume: Confirm support/resistance. High volume at a level = institutional activity; low volume = fragile support/resistance likely to fail.
Practical tip: Old support becomes new resistance and vice versa after a breakout.
Daily chart with a major support level marked
Stock market chart illustrating support (S) and resistance (R) levels in technical analysis with candlestick patterns.
Advanced Timeframe & Multi-Timeframe Analysis
Daily and Weekly: Reveal long-term trends, major breakout/breakdown points.
Intraday (5m/15m/1h): Used for pinpoint entries for swing and day traders.
Ask us anything about platforms, integrations, or business growth.
We use cookies and similar technologies that are necessary to run our website. By clicking “Accept,” you agree to our Cookie policy and Privacy policy.