27.02.2020


HTML5 offers a lot of new features. Some of them are really helpful for financial application development, especially for charting:
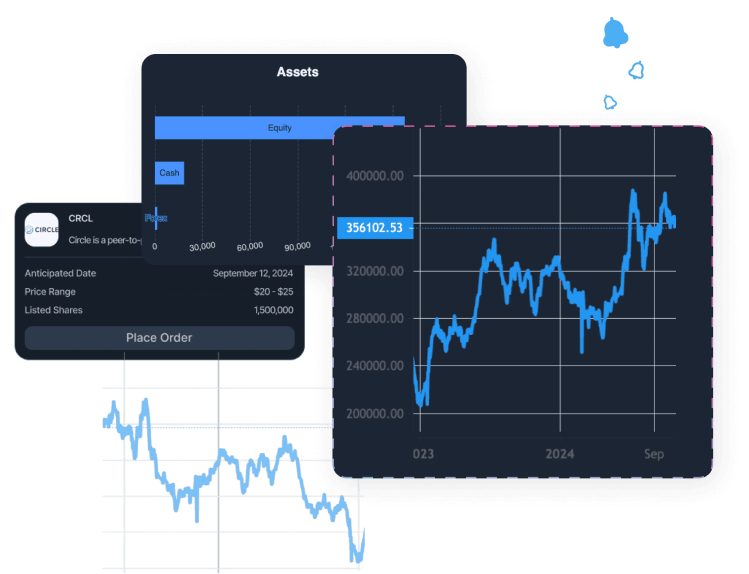
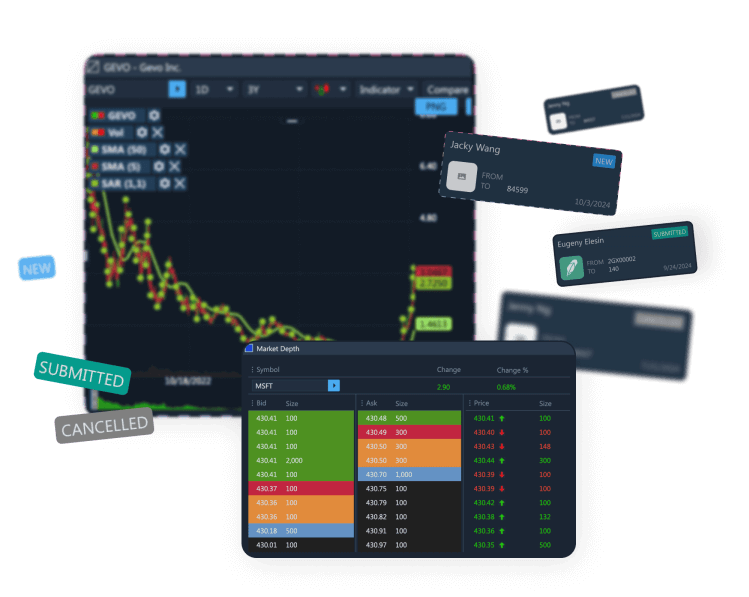
Canvas element provides an important role for developing and drawing objects dynamically – such as, visualizing information or data in a graph. Using Canvas and JavaScript allows easy creation of all types of financial charts (line, bar, candlestick, point, and figure).
The previous HTML version was not appropriate for creating financial charts, so for these purposes, other technologies such as Silverlight and Flex were usually employed. HTML5 provides signigicant advantages over these technologies.
First of all, Silverlight and Flex are plug-ins, and they need to be installed on the client machine. (Pay attention to the version; it is better to install the latest one.) HTML5 requires no installation except a supported browser, and the latest versions of all browsers support it. (See statistics at: html5test.com)
Secondly, the main advantage of HTML5 is that HTML and JavaScript are free and cross-browser compatible. Silverlight and Flex applications cannot be run on tablets, or mobile devices, or some operating systems. HTML5 applications can be run on all of these types of devices in the case of supported browsers. (The latest versions of mobile and tablet browsers support it, too.)
Thirdly, Silverlight and Flex applications are at least 3-4 times greater in size than the HTML5 application because they include libraries.
After a comparison of some free chart libraries, one is able to conclude that in each library the same charts made on different technologies have similar performance characteristics. They use GPU acceleration and show good results. Performance, in this case, cannot be an absolute criterion in this comparison.
New graphics and markup HTML5 features enable creation of financial charts that are as beautiful and handy as charts made using Flex and Silverlight. They look the same, work the same, and have similar performance characteristics. But in addition, charts written using HTML5 are cross-browser compatible, can be run on tablets and mobile devices, require less space, and do not require any installations. Of course, which technology to choose depends upon the purpose it will be used for, but other things being equal, it is better to get the best option (HTML5), isn’t it?

Demo Financial Advisor Software
Manage portfolios with advanced rebalancing and real-time insights.
Access customizable client reports and streamlined compliance tools.
Designed for advisors seeking efficient client and portfolio management.

Demo Advanced Trading Platform
Test multi-asset strategies with real-time and historical data.
Analyze market depth, execute complex options, and algorithmic orders.
Ideal for refining strategies and risk management before live trading.

Demo Paper Trading Platform
Practice trading with virtual funds in real market conditions.
Simulate cash, margin, and day-trader accounts to gain experience.
Perfect for honing skills in a risk-free, customizable environment.