09.10.2025

Navigating turbulent markets demands reliable, technologically advanced tools for tracking volatility. This guide reviews must-have mobile and desktop apps that empower brokers, risk teams, and active traders to monitor, analyze, and respond to market swings in real time. With volatility surging amid tariff turmoil and global uncertainty, tracking the “fear gauge” the VIX and related metrics is essential for survival and success in 2025.
Volatility measures the magnitude of price fluctuations; it is the pulse of the financial marketplace. There are two types to know: historical volatility (actual market price changes) and implied volatility (future expectations embedded in options prices). Typically, when volatility spikes, stock prices fall hence the VIX’s reputation as Wall Street’s “fear gauge”.
Behavioral finance studies confirm that volatility is amplified by investor psychology, including herding and loss aversion. Understanding and tracking these metrics helps professionals distinguish between emotion-driven spikes and shifts rooted in market fundamentals.
For fast reference, here’s a comparison of the top 7 volatility tracking apps used by professional and retail traders:
| Feature | TradingView | ThinkorSwim (TOS) | Koyfin | VectorVest | Webull | Yahoo Finance | Stock Rover |
| Primary Focus | Charting /Analysis | Options /Complex | Institutional | Signals | RT trading | Free/News | Screening/Risk |
| VIX Tracking | Yes | Yes | Yes | Limited | Limited | Yes | Limited |
| Implied Volatility (IV) | Limited | Excellent | Good | Good | Good | No | No |
| Volatility Alerts | Yes | Yes | No | Yes | Yes | Limited | No |
Volatility App Features Comparison – Top 7 Apps for Tracking Stock Market Volatility
TradingView’s web platform offers advanced charting, volatility overlays, and social strategy sharing for over 50 million users.
Key Volatility Tracking Features
Ideal for Analysts and Strategy Backtesting
The platform’s Pine Script lets users create, test, and share custom volatility strategies, while real-time market breadth visualization supports risk management.
ThinkorSwim remains the leader for serious options traders, offering best-in-class metrics and scanners.
Implied Volatility Rank and Percentile
Volatility Alert Systems and Scanners
Koyfin stands out for macro analysis, letting traders build custom dashboards tracking VIX/VXN and global risk indices in a historical context.
Tracking Global Market Fear
VectorVest’s VST rating (Value, Safety, Timing) and Comfort Index (CI) blend volatility analysis with easy-to-read buy/sell signals.
VST and Market Timing
Webull’s mobile-first option democratizes volatility monitoring providing over 50 technical indicators and options data for fast, informed trading.
Advanced Charting and Volatility Features
Yahoo Finance gives beginners and mobile traders basic volatility tracking, including VIX levels and customizable watchlists plus news feeds.
Pros and Cons
Stock Rover’s strength is belief in long-term portfolio management. It screens for high/low-beta stocks and historical volatility patterns.
Pros and Cons
Active trading and portfolio risk management depend on translating volatility metrics to real decisions.
Understanding VIX signals helps investors anticipate shifts:
| VIX Level Range | Market Condition | Trader Response | App Alert Priority |
| Below 15 | Low Volatility Bull Phase | Complacent Market – Consider Taking Profits | Low |
| 15-20 | Pullback Within Bull Trend | Caution – Monitor for Breakouts | Medium |
| 20-28.5 | High Volatility/Clear Pullback | High Risk – Defensive Positioning | High |
| Above 28.5 | Confirmed Bearish Phase | Extreme Fear – Potential Buying Opportunity | Critical |
The math behind real risk:
Q: What is the single best metric for predicting a market crash?
A: VIX spikes above 30 historically signal imminent selling or panic.
Q: How does implied volatility affect options pricing?
A: Higher IV generally boosts option premiums, making it more expensive to buy options and more lucrative to sell.
Q: Can I trade the VIX directly?
A: Yes through VIX futures, ETFs, and options; platforms like TradingView, ThinkorSwim, and Koyfin allow direct VIX trading.
Q: What is the best free volatility tracking app?
A: Yahoo Finance for basic VIX tracking; TradingView’s free tier for technical volatility overlays.
Q: Should long-term investors worry about daily stock volatility?
A: Not for core positions focus on Beta and historical volatility for strategic portfolio construction.
ETNA Trading’s multi-custodian support, real-time VIX alerts, and compliance automation position it as a premier choice for broker-dealers and RIAs.
| Feature | ETNA Trading | TradingView | ThinkorSwim | Interactive Brokers | TradeStation |
| Volatility Features | VIX, alerts, multi-cust | Adv. charting, VIX | IV rank, scanners | API, advanced orders | Backtesting, risk |
| Target Audience | Brokers, RIAs | Traders, retail | Options traders | Pros, institutions | Retail, pros |
| Key Advantage | White-label, compliance | Social sharing | TD integration | Global, low cost | Automation, backtes |
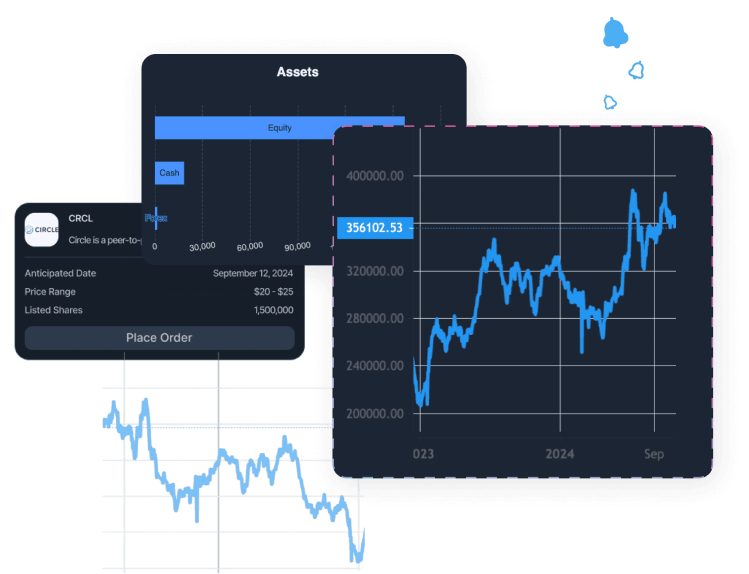
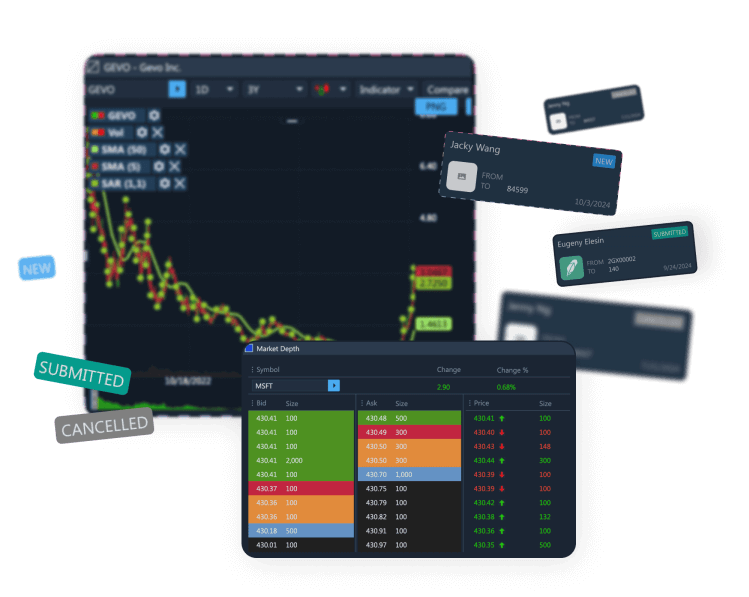
ETNA Web Trader platform interface showing live stock tracking, charts, and trading features for monitoring market volatility
Choosing the right volatility tracking app depends on trading style, risk management needs, and the desired balance between analytics depth and user experience.
For robust risk management and timely decision-making in volatile 2025 markets, diversify your workflow across two or more of these platforms. Combine advanced desktop analytics, mobile alert systems, and compliance-focused white-label solutions for the ultimate volatility response strategy.

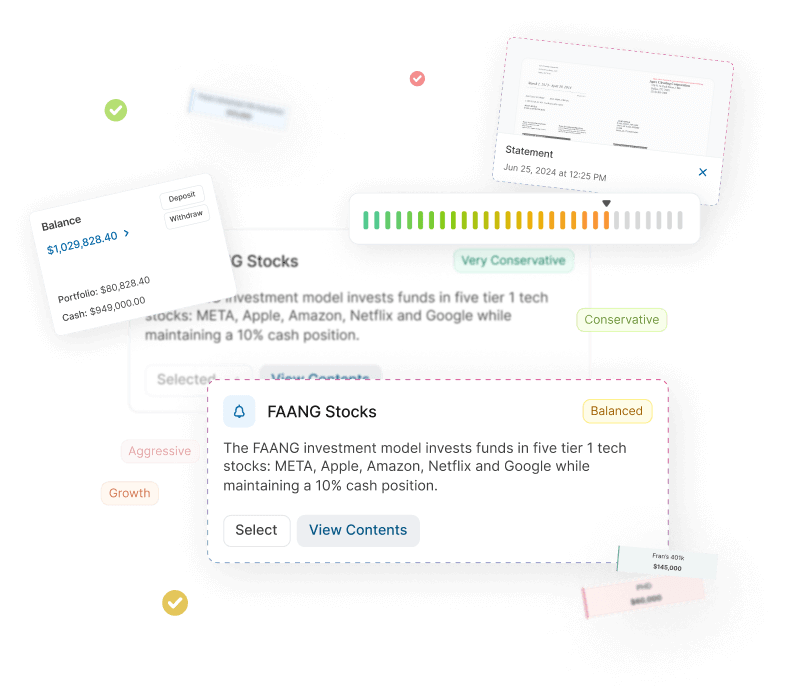
Demo Financial Advisor Software
Manage portfolios with advanced rebalancing and real-time insights.
Access customizable client reports and streamlined compliance tools.
Designed for advisors seeking efficient client and portfolio management.

Demo Advanced Trading Platform
Test multi-asset strategies with real-time and historical data.
Analyze market depth, execute complex options, and algorithmic orders.
Ideal for refining strategies and risk management before live trading.

Demo Paper Trading Platform
Practice trading with virtual funds in real market conditions.
Simulate cash, margin, and day-trader accounts to gain experience.
Perfect for honing skills in a risk-free, customizable environment.