Book a Demo
Book a Demo

ETNA's Blog

Table of contents

Product Marketing Manager at ETNA, with a background in B2B fintech and a focus on crafting innovative solutions for brokers and dealers.

rocket
Industry insights you won’t delete.
Delivered by ETNA


    submit

    29.10.2025

    author

    Anna Orestova

    Verified

    The Ultimate Guide to Day Trading Charts and Timeframes

    img
    Table of contents

    Understanding the Foundations: Why Charts and Timeframes Matter

    In today’s rapidly evolving financial markets, where artificial intelligence drives 89% of all trading volume, mastering daily chart analysis has become more critical than ever for traders seeking consistent profitability. While the statistics reveal that only 13% of day traders maintain profitability over six months, those who combine advanced charting techniques with disciplined risk management and cutting-edge platforms, such as ETNA Trading, can dramatically improve their odds of success. This comprehensive guide explores how daily charts serve as the foundation for strategic trading decisions, incorporating industry best practices, AI-powered trading trends, and proven technical analysis methods that professional traders use to achieve consistent returns in volatile markets.

    Key Takeaways:

    • Markets in 2025 are dominated by technology: 89% of all trading volume is now algorithmic or AI-driven.​
    • Successful traders blend charting mastery with risk management and smart tools especially on platforms like ETNA.​
    • The right chart and timeframe reveal opportunities often missed with a “price only” approach.

    Charts and Timeframes Quick Definitions:

    • Trading Chart: A visual history of price and volume.
    • Timeframe: Data grouping for each bar/candle (e.g., 1-minute, 5-minute, or daily chart).

    Why They Matter:

    • Highlight market sentiment, allow trade timing, and clarify trend vs. noise.
    • Support both strategy (bigger trends/levels) and tactics (precise entries/exits).

    Charting 101: The Visual Language of the Market

    • Charts show high, low, open, close, and volume in a snapshot.
    • Timeframes “zoom in” for scalping or “zoom out” for longer trends.
    • Candlesticks, Heikin-Ashi, and bar charts are the most popular for day trading.
    Charting 101

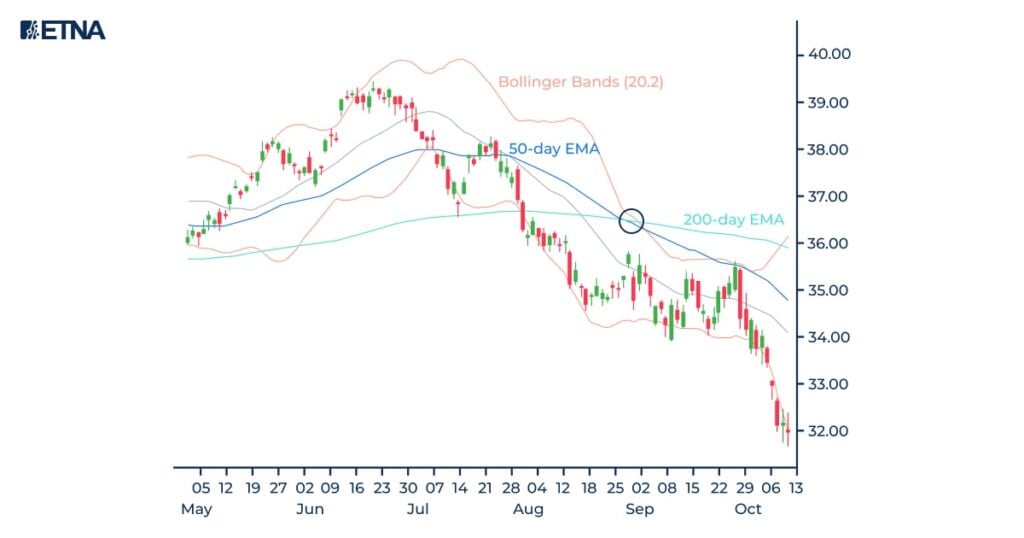
    Daily stock chart featuring Bollinger Bands and 50-day & 200-day EMAs to illustrate technical analysis indicators

    Essential Day Trading Charts Explained

    Bar Data Charts: Candlesticks vs. Heikin-Ashi

    Candlestick Patterns Cheat Sheet

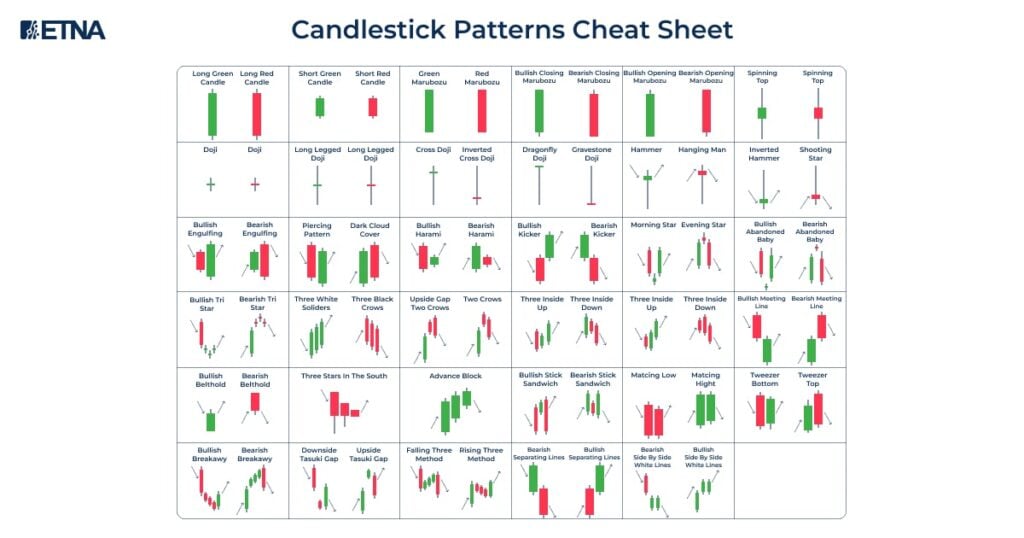
    Candlestick patterns cheat sheet illustrating key bullish and bearish formations for day trading strategies 

    Chart TypeProsCons
    CandlestickShows open/high/low/close; quick reversal signals; strong for breakouts​.Noisy on short frames; false breakouts are common
    Heikin-AshiSmoother, helps find trends​.Lags may miss sudden turns

    Example Candlestick Patterns:

    • Hammer (bullish reversal)
    • Engulfing pattern (trend reversal)
    • Doji/star (trend pause or reversal)
    • Morning/Evening Star (strong reversals)

    (insert cheat sheet)

    Best practice: Always confirm volume before trading a pattern.

    Advanced Charts: Footprint and Volume Profile

    Footprint Chart:

    • Real-time visual of order flow, buying/selling pressure.
    • Pinpoints aggressive buyers/sellers, hidden resistance.

    Volume Profile:

    • Displays volume by price, not just by time.
    • Finds support/resistance where volume is high (“high-volume nodes”).
    • Reveals Point of Control (POC): area with most trading crucial for entries/exits.​

    Key Features (Volume Profile):

    • Highlights major price/volume clusters where institutions trade.
    • Anticipate “bounce” and “breakout” zones.
    • Helps avoid false signals in choppy markets.

    (example: daily chart w/EMAs, Bollinger Bands, volume)

    Selecting the Best Time Frame for Day Trading

    Why choice matters:

    • Fast timeframes (1-minute, tick) deliver more setups, but with more noise.
    • Longer ones (15-minute, 1-hour, daily) filter noise, but fewer trades.
    TimeframeTypical UseProsCons
    1-minScalpingFast feedbackLots of false signals
    5-minIntraday swingGood balanceStill some whipsaws
    15-minMini-positionLess noise, clearer trendFew trades possible

    Best Practice:

    • Use multiple timeframes for confirmation: Daily/Hourly for trend, 5/15-min for entry.​
    • Align high timeframe direction with low timeframe execution.

    Adjusting Timeframes for Different Trading Styles

    Scalpers (1-min/Tick):

    • Rapid entries/exits.
    • Look for reversals at large volume nodes.
    • Must avoid “choppy” or news-driven periods.

    Intraday Swing Traders (5, 15-min):

    • Hold trades for hours.
    • Follow trend lines and moving averages.
    • Confirm entry on the daily chart for maximum edge.

    Multiple Timeframe Analysis (MTFA):

    • Trend = high frame (Daily, 4H)
    • Structure = mid frame (1H, 15M)
    • Entry = lowest frame (5M, 1M)
    • Each level must agree on the highest probability trades.​

    Diagram Suggestion: Show three timeframes stacked, entry at the “confluence.”

    Case Study: Integrating Charts and Timeframes for a High-Probability Setup

    1. Identify the macro-trend on the daily chart.
    2. Spot consolidation or breakout pattern on 15-minute.
    3. Enter on a 5-minute chart with a volume spike.

    Benefits:

    • Reduces whipsaw trades.
    • Entries are in sync with powerful, sustainable moves.

    Common Mistakes to Avoid

    1. Trading off noise ignoring trend in higher timeframe.
    2. Skipping volume confirmation (major cause of failed breakouts).
    3. Add to losers (“averaging down”) instead of cutting losses.
    4. Chasing missed moves during news or high-volatility events.
    5. Not managing risk trading too large or without a hard stop-loss.

    Risk Management Essentials

    Stats to Know:

    • Only 13% of day traders are profitable at 6 months; fewer still after 5 years.​
    • 88% of consistently profitable traders use stop-loss orders on every trade.​
    • 62% use position sizing as their main capital control.​

    Top Risk Tools & Best Practices:

    • Stop-loss orders: Automatic exits to preserve capital; base them on technical levels.
    • Position sizing: Risk only 1–3% per trade.
    • Daily loss limit: Walk away after max drawdown to avoid emotional spirals.
    • Risk-reward rules: Never enter trades with less than 1:2 risk/reward.
    • Bracket orders: Set both profit and loss targets at entry.​

    The ETNA Trading Platform: Advanced Charting for Modern Traders

    Key Features (2025 Edition):

    • Fully custom charting: candlesticks, volume profile, multi-asset and multi-timeframe.​
    • Institutional-grade risk analytics: P/L visualization, scenario modeling, bracket orders.​
    • Fast, direct exchange routing; low latency for rapid fills.​
    • Real-time alerts, watchlists, and drag-and-drop dashboard layout.​
    • Trading from charts: instant entries or exits.
    • Algorithmic and AI module: scan markets for patterns, probabilities, and signals.

    Why It Matters:

    • Integrates all critical trading, risk, and charting tools in one platform.
    • White label and multi-device support.
    ETNA Trading Platform

    Conclusion: Charting Your Path to Profitability

    • Mastering daily charts and the right timeframes is a repeatable path to profit.
    • Combine chart patterns, volume, and well-chosen tools (like ETNA) for results.
    • Discipline and risk management outshine “perfect signals”.

    Frequently Asked Questions (FAQ)

    4H can work for swing and hybrid traders; most day traders use 1-, 5-, or 15-min for entries.

    5-minute and 15-minute are most used for breakouts; always confirm with a higher frame and volume.

    1-minute for scalping, 5-minute for intraday moves, 15-minute for swing day trades.

    Yes, but higher timeframes (5-min and up) filter noise and improve signal reliability.

    Explore our platforms with
    web and mobile demos
    Financial Advisor Software
    Advanced Trading Platform
    Paper Trading Platform

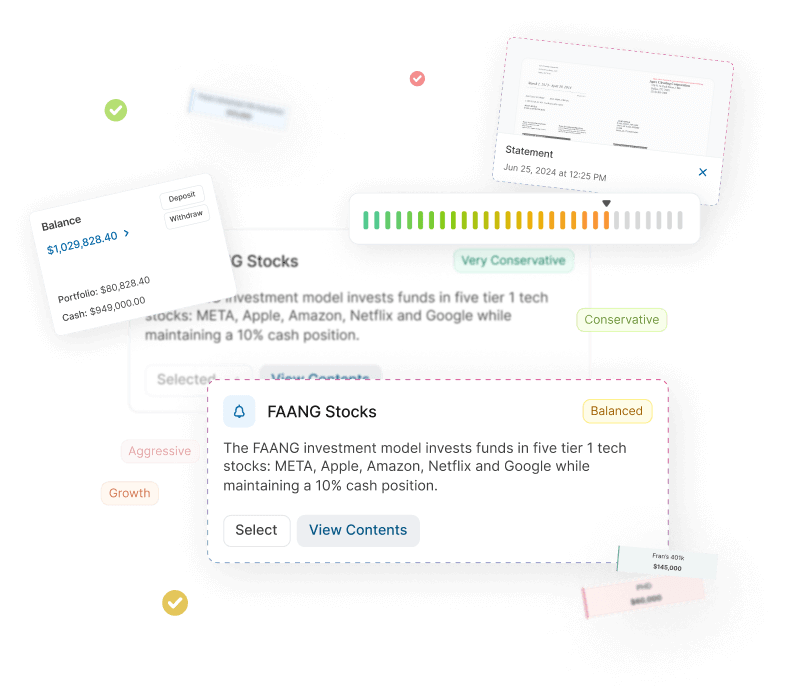
    Demo Financial Advisor Software

    Manage portfolios with advanced rebalancing and real-time insights.

    Access customizable client reports and streamlined compliance tools.

    Designed for advisors seeking efficient client and portfolio management.

    Try Web Demo
    image

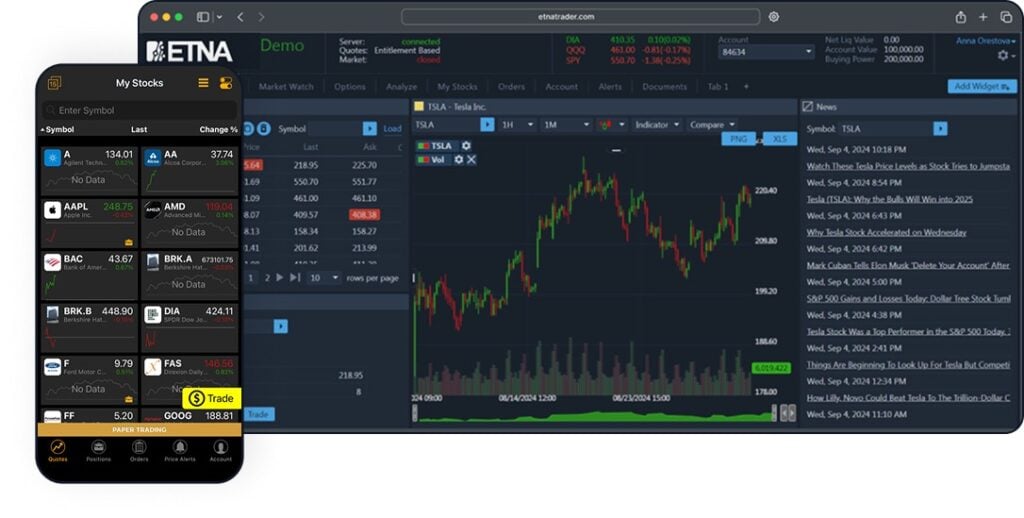
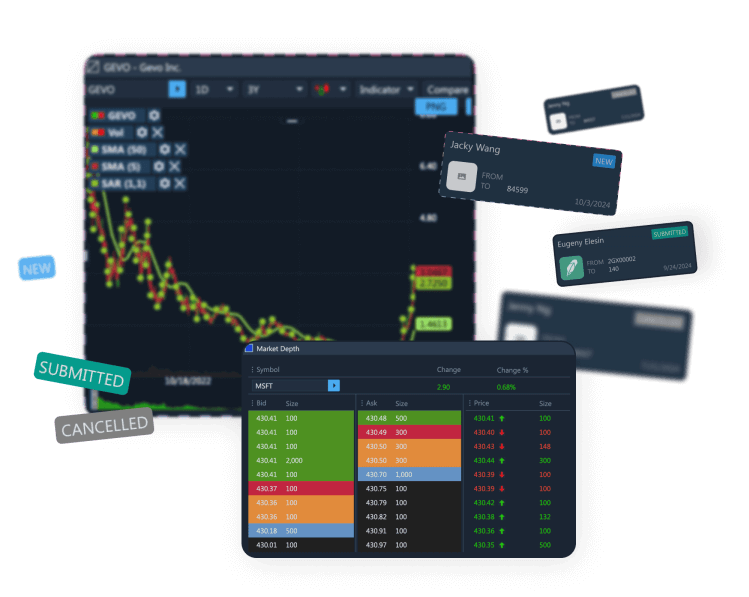
    Demo Advanced Trading Platform

    Test multi-asset strategies with real-time and historical data.

    Analyze market depth, execute complex options, and algorithmic orders.

    Ideal for refining strategies and risk management before live trading.

    Try Web Demo
    image

    Demo Paper Trading Platform

    Practice trading with virtual funds in real market conditions.

    Simulate cash, margin, and day-trader accounts to gain experience.

    Perfect for honing skills in a risk-free, customizable environment.

    Try Web Demo
    image
    Book a Demo Free Simulator