05.02.2026

The wealth management industry stands at an inflection point where client expectations, technological capabilities, and competitive dynamics are converging to redefine advisory relationships. Financial advisors and broker-dealers who fail to leverage sophisticated client analytics and engagement dashboards risk losing clients to more digitally savvy competitors. The evidence is compelling: firms using client portals report an 80% improvement in client trust, 64% greater loyalty, and 67% boost in referrals. More striking still, one advisory firm brought in $1.5 billion in new committed assets immediately after rolling out an enhanced client portal.
This transformation reflects a fundamental shift in how clients evaluate their advisors. With 71% of consumers expecting customized interactions and 69% of clients checking their portals more frequently than two years ago, the quality of data presentation has become as critical as investment performance itself. For wealth management professionals, the question is no longer whether to adopt analytics-driven engagement tools, but how quickly they can implement systems that turn raw data into relationship-building insights.
Financial advisors have historically relied on quarterly statements, annual reviews, and periodic check-ins to maintain client relationships. This cadence worked when information asymmetry favored the advisor, and clients had limited visibility into their portfolios between formal meetings. Today’s environment has fundamentally altered this dynamic.
Modern clients particularly the 29.6% of CFP professionals now under 40 expect real-time access to their financial information, contextualized insights, and proactive communication. They’re accustomed to the instant gratification of consumer technology: Amazon’s one-click purchasing, Netflix’s personalized recommendations, and Apple’s seamless ecosystem. When their wealth management experience falls short of these digital standards, dissatisfaction grows, and loyalty erodes.
The gap between traditional reporting and real-time analytics represents more than a technological upgrade it’s a shift in the advisor-client relationship paradigm. Static quarterly reports arrive weeks after the period ends, presenting historical data with limited context. Real-time engagement dashboards, by contrast, provide instant portfolio visibility, interactive scenario modeling, and proactive alerts that keep clients informed and engaged between formal reviews.
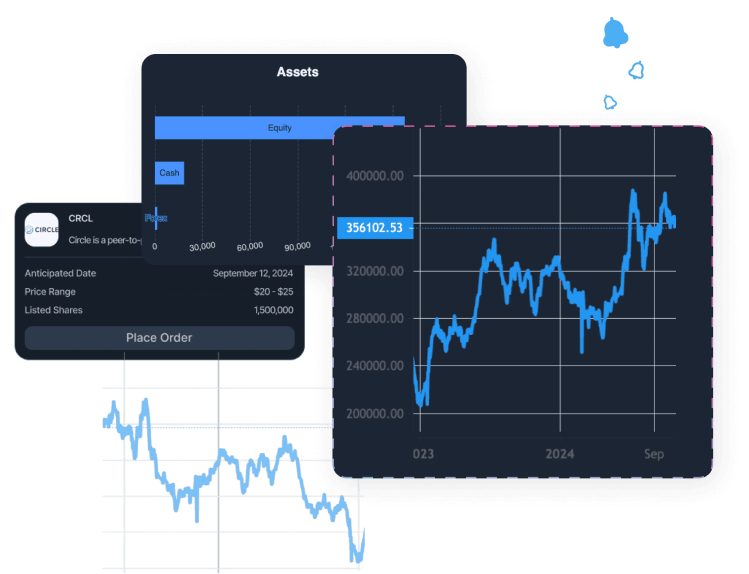
Consider the difference in client experience: A traditional advisor sends a quarterly PDF showing a 12% year-to-date return. A digitally enabled advisor provides a dashboard where clients can see their daily position, drill down into individual holdings, model “what-if” scenarios for retirement timing, and receive automated notifications when portfolio drift requires rebalancing. The latter approach doesn’t just inform clients it engages them as active participants in their financial journey.
Many wealth management firms conflate two distinct analytics needs: user-facing client analytics designed for investor consumption, and internal business intelligence (BI) systems that drive operational decisions. While both rely on data, they serve fundamentally different purposes and require separate design approaches.
Internal BI systems help firms answer questions like: Which client segments are most profitable? Where are service bottlenecks occurring? Which advisors need coaching support? What’s driving client attrition? These systems aggregate data across the entire book of business, identify patterns in advisor productivity, and surface operational inefficiencies. They’re built for internal stakeholders executives, compliance officers, operations managers who need consolidated views and longitudinal trends.
User-facing analytics, by contrast, are personalized, real-time, and action-oriented. They answer the questions clients actually care about: Am I on track to retire at 62? How did market volatility this week affect my portfolio? What’s my after-tax return? How does my performance compare to my benchmark? These dashboards prioritize clarity, visual appeal, and contextual relevance over comprehensive data dumps.
The distinction matters because firms that repurpose internal BI tools for client-facing applications typically fail to deliver compelling user experiences. Clients don’t want 40-page reports with every conceivable metric; they want curated insights that help them make better decisions. Effective engagement dashboards balance comprehensive data access with intelligent filtering, allowing clients to drill deeper when interested while maintaining a clean, intuitive primary view.
Leading wealth management technology platforms understand this dichotomy. The ETNA white-label Trading Platform exemplifies this approach by offering dual analytics layers: sophisticated back-office tools for advisors and compliance officers, and sleek client-facing interfaces with customizable dashboards, real-time portfolio visualization, and mobile accessibility. This architectural separation ensures that each stakeholder receives the analytics they need in the format that best serves them.
| Analytics Type | Primary Audience | Key Purpose | Update Frequency | Design Priority |
| User-Facing Analytics | Clients/Investors | Personal portfolio monitoring, goal tracking, decision support | Real-time/Intraday | Simplicity, visual appeal, and mobile optimization |
| Internal Business Intelligence | Advisors/Operations/Compliance | Firm performance, risk management, client segmentation, and productivity | Daily/Weekly/Monthly | Comprehensiveness, drill-down capability, and regulatory reporting |
The relationship between analytics quality and client retention is no longer theoretical it’s empirically validated. Financial advisors using sophisticated client portals with integrated client analytics report a median revenue of $570,000 per advisor compared to $500,000 for those with less robust digital engagement. More importantly, these “Power Portal Users” see tangible improvements in the metrics that matter most: 80% report stronger client trust, 64% experience greater loyalty, and 67% receive more referrals.
These outcomes stem from several mutually reinforcing mechanisms:
Transparency builds confidence. When clients can verify portfolio positions, transaction history, and performance metrics at any time, they develop greater confidence in their advisor’s recommendations. The traditional opacity of quarterly reporting created information asymmetry that some clients found unsettling. Real-time dashboards eliminate this anxiety by making data continuously accessible. Research confirms this dynamic: 91% of clients with portal access report satisfaction with their digital tools, and advisors who prioritize communication frequency see stronger client retention.
Proactive communication strengthens relationships. Predictive analytics embedded in modern engagement dashboards can identify clients at risk of dissatisfaction before they express concerns. By flagging reduced login frequency, declining engagement with communications, or portfolio drift beyond stated risk tolerances, these systems enable advisors to proactively reach out. Firms leveraging predictive analytics respond to at-risk accounts up to 80% faster, reducing churn by 15-30% while boosting revenue by 3-5%.
Personalization demonstrates value. Generic advice and cookie-cutter portfolios no longer suffice in an era where AI can deliver customized recommendations at scale. Behavioral analytics tools analyze client interaction patterns, risk responses, and engagement behaviors to surface personalized insights. For instance, if a client repeatedly checks their portfolio during market volatility, an AI-driven system might automatically send educational content on long-term investing principles or schedule a proactive advisor call. This level of personalization was impossible at scale until recently; now it’s becoming table stakes.
Education empowers decision-making. Sophisticated dashboards don’t just present data they contextualize it. Rather than showing a client that their portfolio returned 8.5% last quarter, advanced platforms break down performance attribution (What drove that return? How much came from equity exposure vs. fixed income?), compare results against relevant benchmarks, and project forward scenarios based on different market conditions. This educational approach transforms clients from passive recipients of advice into informed partners in the planning process.
The impact on advisor productivity is equally significant. When clients have 24/7 access to their financial information, routine inquiries (“What’s my current balance?” “Did that trade execute?”) decline sharply. Advisors who spend an average of 27 hours per week on direct client tasks can reallocate time from administrative questions to high-value activities such as financial planning, tax optimization, and relationship deepening. The result: advisors with $12,500+ average revenue per client offer 20 annual touchpoints, compared with 14 for lower-revenue advisors, demonstrating that technology enables higher-touch service without overwhelming advisors’ capacity.
Effective client analytics require careful metric selection. Dashboards cluttered with dozens of data points overwhelm users and obscure meaningful insights. The most successful implementations focus on a curated set of metrics that balance client interests with firm operational needs.
Profit & Loss (P&L) with Time-Weighted Context. Clients want to know one thing above all: Am I making money? However, raw P&L figures without context can be misleading. A $50,000 gain sounds impressive until you realize it’s on a $5 million portfolio during a market surge. Advanced dashboards provide time-weighted returns, benchmark comparisons, and risk-adjusted performance metrics (like Sharpe ratios) that put gains and losses in proper perspective. Clients with access to contextualized P&L data show a 17.5% higher sentiment during advisor meetings, indicating that transparency around performance even in difficult markets strengthens rather than weakens relationships.
Risk Exposure and Portfolio Composition. Sophisticated investors want to understand not just returns, but the risk taken to achieve them. Real-time visualization of asset allocation, sector exposure, and concentration risk helps clients grasp portfolio construction logic. When market volatility spikes, these dashboards allow advisors to demonstrate that portfolios remain within stated risk parameters, reducing anxiety and preventing panic-driven decisions.
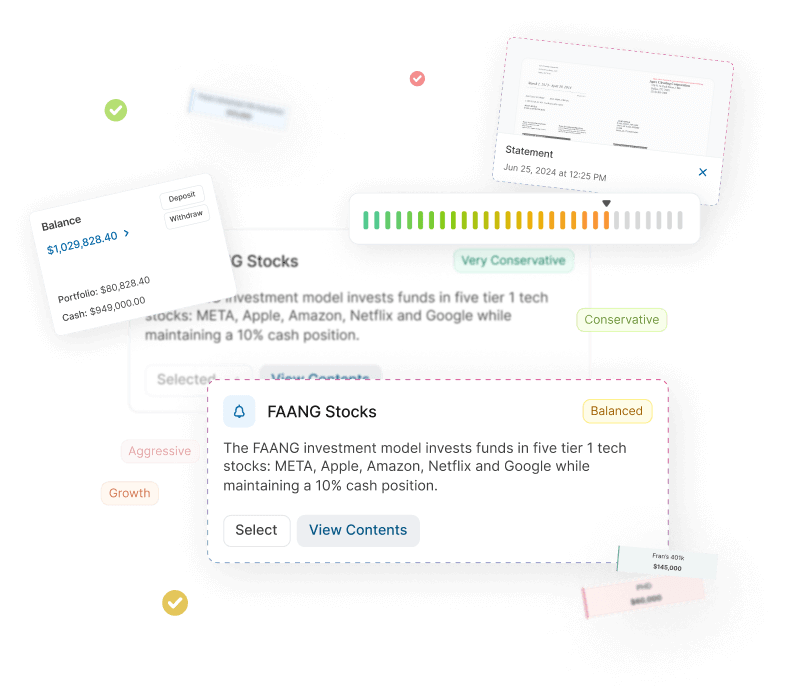
Goal Progress Tracking. Abstract returns are less meaningful to most clients than concrete progress toward specific objectives: retirement funding, college savings, wealth transfer planning. Modern engagement dashboards link portfolio performance directly to goal achievement, showing clients whether they’re on track, ahead of schedule, or need to adjust contributions. This goal-centric approach makes the advisor’s value proposition tangible and actionable.
| Metric | Client Benefit | Advisor/Firm Benefit |
| Time-Weighted P&L | Clear understanding of actual performance vs. market | Reduces performance attribution questions, sets realistic expectations |
| Risk-Adjusted Returns (Sharpe Ratio) | Confidence that gains aren’t from excessive risk | Demonstrates sophisticated portfolio management, justifies fees |
| Goal Progress Indicators | Tangible visibility into retirement readiness | Surfaces planning gaps, creates cross-sell opportunities |
| Execution Quality (Fill Rates, Latency) | Trust in trade execution | Demonstrates operational excellence, supports premium pricing |
| Tax-Loss Harvesting Opportunities | Awareness of tax optimization | Showcases proactive tax planning, adds fee-justifying value |
While client-facing dashboards emphasize performance and progress, advisors need a parallel set of metrics focused on relationship health and business development opportunities:
Client Activity Levels and Login Frequency. The best predictor of client satisfaction is engagement. Clients who regularly log into their portals, review statements, and interact with planning tools demonstrate higher retention rates. Advisors should monitor login frequency, time spent on the platform, and feature utilization to identify disengaged clients before they churn. When a previously active client stops logging in, it’s often an early warning sign of dissatisfaction or distraction by competing advisors.
Churn Risk Indicators. Sophisticated analytics platforms use machine learning to identify at-risk clients based on behavioral patterns, including reduced responsiveness to communication, declining portfolio activity, increased withdrawal frequency, or failure to refer new clients. By quantifying churn risk and proactively surfacing it, these systems enable advisors to intervene before relationships deteriorate irreparably.
Assets Under Management (AUM) Trends and Deposit/Withdrawal Patterns. Tracking account funding patterns helps assess clients’ financial health and satisfaction. Clients consistently adding assets signal confidence; those making irregular withdrawals may face financial stress requiring planning adjustments. Volume heatmaps showing when clients are most active can inform optimal outreach timing for maximum engagement.
The wealth management industry is experiencing a technology revolution driven by artificial intelligence and machine learning. These technologies aren’t future possibilities they’re reshaping how portfolios are managed, advice is delivered, and client relationships are maintained today.
Algorithmic Trading Dominance. Between 60-70% of all equity trades are now executed algorithmically, with the global algorithmic trading market growing from $15.55 billion in 2021 to a projected $32.5 billion at a 12.2% compound annual growth rate through 2030. For wealth management clients, this means access to institutional-quality execution, reduced slippage, and improved fill rates that were previously available only to large hedge funds and proprietary trading desks.
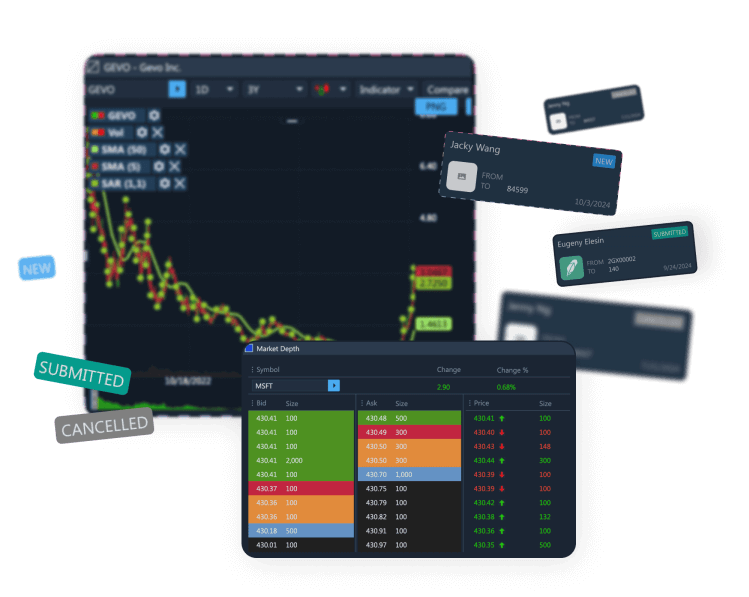
The ETNA Trading Platform exemplifies this trend by offering multi-venue order routing, millisecond-grade execution pipelines, and direct exchange connectivity. These capabilities allow even small advisory firms to provide clients with best-execution guarantees, transparent pricing, and sophisticated order types (contingent orders, trailing stops, algorithmic strategies) that enhance portfolio management precision.
Robo-Advisors and Hybrid Models. Pure robo-advisory services captured headlines a decade ago by promising to democratize wealth management through automation. The reality has proven more nuanced: hybrid models combining algorithmic portfolio management with human advisor oversight now dominate, capturing 60.7% of robo-advisor revenue in 2024. This reflects clients’ desire for technology-enabled efficiency without sacrificing personalized guidance during complex decisions or emotional market periods.
Significantly, robo-advisor adoption is expanding beyond young, tech-savvy investors. High-net-worth individuals now contribute 55.3% of robo-advisor volume, indicating that affluent clients value algorithmic efficiency when appropriate. Forward projections suggest AI-driven investment tools will become the primary source of advice for retail investors by 2027, with usage approaching 80% by 2028. Advisors who position themselves as orchestrators of both human insight and machine intelligence will thrive; those who resist automation risk obsolescence.
Predictive Analytics for Personalization. Machine learning algorithms excel at pattern recognition in large datasets, enabling unprecedented personalization at scale. By analyzing historical client behavior, market conditions, macroeconomic indicators, and sentiment data, AI systems can predict client needs before they’re explicitly stated. For example, predictive models might identify that a client approaching age 60 with declining portfolio contributions likely needs retirement income planning, automatically prompting the advisor to schedule a comprehensive review.
The impact on client acquisition and retention is substantial. Financial advisors using AI-powered client management tools report a 25% increase in new business acquisitions and 30% reduction in client acquisition costs. Personalized marketing enabled by behavioral analytics drives up to 20% higher customer engagement, while firms implementing predictive churn models see 15-25% reductions in client attrition.
AI-Enhanced Risk Management. Modern portfolio management increasingly relies on AI for real-time risk assessment and automated rebalancing. Machine learning models can detect market anomalies, identify correlation breakdowns, and adjust portfolio allocations faster than human managers. During periods of extreme volatility, these systems provide decision support that helps advisors maintain discipline and avoid emotional reactions.
The ETNA platform’s sophisticated analytics suite integrates multi-factor analytics, automated volatility scanning, and probability-based trade recommendations, empowering advisors to make data-driven decisions at an institutional-quality level. Real-time Greeks calculations, stress-test scenarios, and P&L simulations allow advisors to model complex options strategies before execution, reducing risk and improving client outcomes.

Demo Financial Advisor Software
Manage portfolios with advanced rebalancing and real-time insights.
Access customizable client reports and streamlined compliance tools.
Designed for advisors seeking efficient client and portfolio management.

Demo Advanced Trading Platform
Test multi-asset strategies with real-time and historical data.
Analyze market depth, execute complex options, and algorithmic orders.
Ideal for refining strategies and risk management before live trading.

Demo Paper Trading Platform
Practice trading with virtual funds in real market conditions.
Simulate cash, margin, and day-trader accounts to gain experience.
Perfect for honing skills in a risk-free, customizable environment.