Book a Demo
Book a Demo

ETNA's Blog

Table of contents

Product Marketing Manager at ETNA, with a background in B2B fintech and a focus on crafting innovative solutions for brokers and dealers.

rocket
Industry insights you won’t delete.
Delivered by ETNA


    submit

    18.09.2025

    author

    Anna Orestova

    Verified

    How to Benchmark Portfolio Performance: Comprehensive Research on Wealth Management Best Practices and 2025 Trends

    img
    Table of contents

    The Critical Imperative of Modern Portfolio Benchmarking

    Portfolio performance benchmarking has evolved from a simple comparison exercise to a sophisticated multi-dimensional framework that drives investment strategy, risk management, and client communication in 2025. With global Assets Under Management (AUM) reaching unprecedented levels and technology reshaping every aspect of wealth management, the ability to accurately measure and evaluate portfolio performance has become the cornerstone of successful investment management.

    The wealth management industry stands at an inflection point where traditional benchmarking approaches must adapt to accommodate complex alternative investments, ESG mandates, AI-driven strategies, and increasingly sophisticated client expectations. This comprehensive research examines current best practices, emerging trends, and the statistical realities shaping portfolio benchmarking in 2025.

    Industry Statistics and Market Context

    Massive Scale and Growth Trajectory

    AUM Growth

    The global wealth management industry has reached extraordinary proportions in 2025:

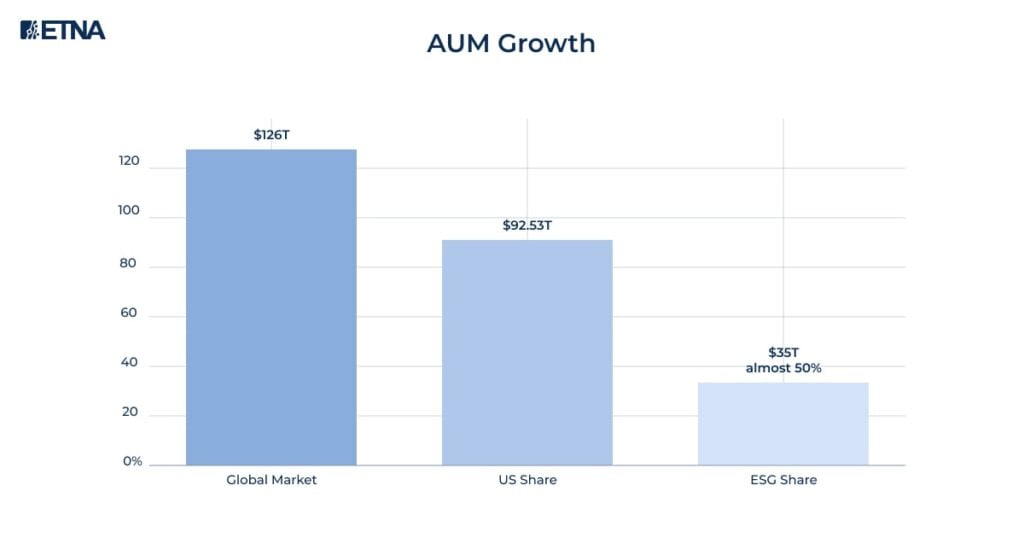
    • Global AUM: Total global Assets Under Management reached $126 trillion in early 2024, growing by 6.3% year-over-year
    • US Market Dominance: The US wealth management market alone accounts for $92.53 trillion in AUM projected for 2025, with $54 trillion representing the largest single market globally
    • Americas Leadership: Assets Under Management across the Americas are projected to reach $103.83 trillion in 2025, with expected 2.34% CAGR through 2029
    • Growth Projections: Industry leaders project 13.4% AUM growth globally for 2025, with US wealth managers forecasting aggressive 17.6% average AUM growth

    Technology Adoption and Digital Transformation

    The technology revolution in wealth management has accelerated dramatically:

    • AI Integration: 41% of financial advisors are already using generative AI tools, with 65% of firms believing AI will improve client relationship management
    • Technology Investment Surge: 54% of advisors expect to increase technology investments in 2025, with 16% average expected increase in tech spending
    • Tech Stack Utilization: Average tech stack utilization across advisors is 60%, with Orion advisors reporting 67% utilization versus 54% for non-Orion advisors
    • Platform Modernization: 65% of advisors say their technology stack is due for an upgrade, while only 35% believe their platform is state-of-the-art

    ESG and Sustainable Investing Impact

    Environmental, Social, and Governance considerations have become central to benchmarking:

    • ESG Market Share: ESG-mandated assets projected to represent 50% of professionally managed investments by 2025, totaling approximately $35 trillion
    • Sustainable Investing Growth: Sustainable investing accounts for 35% of total AUM globally in 2024, showcasing a growing shift toward ethical investments
    • Advisor Adoption: 45% of wealth managers cite ESG as a key driver of client retention

    Comprehensive Best Practices Framework

    1. Multi-Dimensional Benchmarking Architecture

    Multi-Dimensional Benchmarking Architecture

    Policy Benchmarking Foundation
    Cambridge Associates research establishes that policy benchmarks should serve as the primary reference point, directly linked to investment strategy and serving multiple critical functions:

    • Investment Mandate Establishment: Policy benchmarks memorialize the default investment strategy and translate investment objectives into clear mandates
    • Performance Evaluation Standard: Provide attribution analysis showing “what worked and what didn’t” with measurable impact of specific decisions
    • Decision-Making Reference: Create clear reference points for measuring investment decisions that deviate from default positioning
    • Communication Tool: Establish consistent reference points for discussing portfolio management decisions and results

    Comprehensive Framework Components
    Modern benchmarking requires multiple reference points addressing different evaluation needs:

    • Policy Benchmarks: Primary day-to-day reference directly linked to investment strategy
    • Market Benchmarks: Broad market comparisons (S&P 500, MSCI World, etc.)
    • Peer Comparisons: Performance relative to similar portfolios and investment approaches
    • Absolute Return Measures: Direct return targets and risk-adjusted metrics
    • Factor-Based Benchmarks: Analysis based on risk factors and style exposures

    2. Advanced Risk-Adjusted Performance Metrics

    Beyond Traditional Sharpe Ratios
    Modern portfolio evaluation demands sophisticated risk-adjusted measures:

    Sharpe Ratio Enhancement

    • Standard calculation: (Portfolio Return – Risk-Free Rate) / Portfolio Standard Deviation
    • Industry Standards: Sharpe ratios above 1.0 are considered good, above 2.0 are considered excellent, and above 3.0 are considered exceptional
    • 2025 Applications: Enhanced with rolling periods, downside volatility adjustments, and factor decomposition

    Sortino Ratio Superiority

    • Calculation: (Portfolio Return – Risk-Free Rate) / Downside Deviation
    • Advantage: Focuses only on downside volatility, better reflecting investor risk perception
    • Implementation: Particularly valuable for alternative investment strategies and tail risk assessment

    Advanced Risk Metrics Integration

    • Beta-Adjusted Returns: Measuring performance relative to systematic risk exposure
    • Maximum Drawdown Analysis: Critical for understanding worst-case scenario impacts
    • Value-at-Risk (VaR) Modeling: Quantifying potential losses at specific confidence levels
    • Conditional Value-at-Risk: Expected loss beyond VaR threshold for extreme scenarios

    3. Performance Attribution Methodology

    Traditional Brinson Attribution
    Fundamental approach separating allocation and selection effects:

    • Asset Allocation Effect: Impact of overweight/underweight decisions relative to benchmark
    • Security Selection Effect: Value added through individual security selection within asset classes
    • Interaction Effect: Combined impact of allocation and selection decisions

    Factor-Based Attribution Evolution
    More sophisticated analysis using risk factor models:

    • Style Factor Analysis: Growth vs. Value, Large vs. Small Cap exposures
    • Sector/Industry Attribution: Performance impact of sector allocation decisions
    • Geographic Attribution: Regional and country allocation effectiveness
    • Currency Attribution: Impact of foreign exchange exposure decisions

    Risk-Based Attribution Framework
    Comprehensive approach breaking down active risk and corresponding returns:

    • Systematic Risk Contribution: Performance attributable to market factor exposures
    • Idiosyncratic Risk Impact: Security-specific risk and return contributions
    • Total Active Risk Decomposition: Complete analysis of tracking error sources

    4. ESG Integration and Sustainable Benchmarking

    ESG Benchmarking Standards
    Growing regulatory and client demand for ESG performance measurement:

    MSCI ESG Integration

    • ESG Score Benchmarking: Portfolio ESG scores vs. benchmark ESG characteristics
    • Carbon Footprint Analysis: Portfolio emissions intensity vs. traditional benchmarks
    • Sustainable Development Goals (SDG) Alignment: Measuring contribution to UN SDG objectives

    Regulatory Compliance Framework

    • Portfolio Emissions Reporting: Growing requirements for carbon footprint disclosure
    • TCFD Alignment: Task Force on Climate-related Financial Disclosures integration
    • EU Taxonomy Compliance: Alignment with European sustainable finance regulations

    5. Private Markets and Alternative Investment Benchmarking

    Private Asset Integration Challenges
    Cambridge Associates recommends using public market proxies for total portfolio benchmarking:

    Methodology Reconciliation

    • Time-Weighted vs. Money-Weighted Returns: Addressing fundamental measurement differences
    • Public Market Equivalent (PME): Standardized comparison methodology for private investments
    • Direct Alpha Measurement: Net value creation above public market alternatives

    MSCI Private Asset Solutions
    Industry-leading benchmarking for private markets:

    • Private Equity Indexes: Spanning buyout, venture, growth capital strategies
    • Private Credit Benchmarks: Direct lender and specialty finance comparisons
    • Private Real Estate Indexes: Over 250 indexes built on comprehensive market data
    • Infrastructure Benchmarking: Specialized indexes for infrastructure debt and equity

    2025 Technology and Innovation Trends

    AI-Powered Performance Analytics

    Machine Learning Integration

    • Predictive Performance Modeling: AI algorithms forecasting portfolio performance based on factor exposures
    • Dynamic Benchmark Construction: Algorithms creating custom benchmarks based on actual portfolio characteristics
    • Risk Factor Identification: Machine learning identifies previously unknown risk factors affecting performance

    Real-Time Attribution Analysis

    • Continuous Performance Monitoring: Real-time tracking of attribution effects throughout the trading day
    • Automated Reporting: AI-generated performance reports with natural language explanations
    • Anomaly Detection: Automated identification of unusual performance patterns requiring investigation

    Advanced Data Integration

    Alternative Data Sources

    • ESG Data Integration: Real-time ESG scoring and impact measurement
    • Sentiment Analysis: Social media and news sentiment impact on portfolio performance
    • Economic Nowcasting: Real-time economic indicators for context-aware benchmarking

    Multi-Custodian Aggregation
    ETNA platform capabilities enabling unified performance measurement:

    • Cross-Platform Integration: Seamless aggregation across multiple custodial relationships
    • Real-Time Data Reconciliation: Automated data quality and consistency checks
    • Unified Reporting Framework: Single source of truth for portfolio performance across all accounts

    Regulatory Technology (RegTech) Integration

    Automated Compliance Monitoring

    • Performance Disclosure Automation: Automated generation of required performance disclosures
    • Benchmark Governance: Systematic approach to benchmark selection and maintenance
    • Audit Trail Management: Complete documentation of benchmarking decisions and changes

    GIPS Compliance Enhancement

    • Global Investment Performance Standards: Automated GIPS-compliant performance calculation
    • Verification Support: Built-in controls supporting third-party performance verification
    • Composite Management: Automated composite construction and maintenance

    Industry Standards and Regulatory Framework

    Global Investment Performance Standards (GIPS)

    2025 GIPS Requirements
    Updated standards emphasizing benchmark selection and presentation:

    • Benchmark Selection Criteria: Clear documentation of benchmark selection rationale
    • Benchmark Governance: A Formal process for benchmark review and changes
    • Performance Attribution: Enhanced requirements for attribution presentation

    Institutional Limited Partners Association (ILPA) Standards

    2025 Private Equity Reporting Standards
    New ILPA templates for comprehensive performance measurement:

    • Standardized Performance Metrics: Consistent IRR, multiple, and PME calculations
    • Enhanced Transparency: Detailed cash flow reporting and attribution analysis
    • ESG Integration: Mandatory ESG impact reporting for private equity investments

    Regulatory Reporting Evolution

    Enhanced Data Requirements
    Increasing regulatory scrutiny is driving reporting evolution:

    • Form PF Enhancements: Expanded reporting requirements for private fund advisors
    • Form ADV Updates: Enhanced performance disclosure requirements
    • State Regulatory Coordination: Harmonized reporting across state regulators

    ETNA Platform Integration and Capabilities

    Advanced Performance Measurement

    Real-Time Analytics
    ETNA’s comprehensive performance measurement suite:

    • Multi-Dimensional Performance Reporting: Comprehensive analysis across time periods, asset classes, and risk factors
    • Custom Benchmark Construction: Flexible benchmark creation matching specific investment strategies
    • Attribution Analysis: Detailed performance attribution across allocation and selection effects

    Risk Management Integration

    • Real-Time Risk Monitoring: Continuous tracking of portfolio risk metrics and benchmark deviation
    • Scenario Analysis: Stress testing portfolio performance under various market conditions
    • Liquidity Analysis: Assessment of portfolio liquidity relative to benchmark characteristics

    Client Communication Tools

    Automated Reporting

    • Performance Dashboards: Interactive dashboards providing real-time performance insights
    • Client Portal Integration: Seamless access to performance information through client portals
    • Mobile Optimization: Full-featured performance access across all devices

    Customization Capabilities

    • White-Label Solutions: Branded performance reporting matching firm identity
    • Flexible Report Generation: Customizable reports meeting specific client needs
    • Multi-Format Output: Performance data available in multiple formats for various use cases

    Implementation Best Practices

    Benchmark Selection Process

    Strategic Alignment Framework

    • Investment Strategy Linkage: Direct connection between benchmark selection and investment approach
    • Risk Profile Matching: Benchmark risk characteristics aligned with portfolio objectives
    • Liquidity Considerations: Benchmark composition reflecting portfolio liquidity constraints

    Governance Structure

    • Investment Committee Oversight: Formal process for benchmark selection and review
    • Regular Review Schedule: Systematic evaluation of benchmark appropriateness
    • Change Management: Documented process for benchmark modifications

    Performance Evaluation Frequency

    Multi-Horizon Analysis

    • Daily Monitoring: Real-time tracking for risk management purposes
    • Monthly Reporting: Comprehensive performance analysis for operational oversight
    • Quarterly Evaluation: Detailed attribution analysis and strategic review
    • Annual Assessment: Comprehensive evaluation including peer comparisons and long-term analysis

    Communication Strategy

    Stakeholder Engagement

    • Investment Committee Reporting: Executive-level performance summaries with key insights
    • Client Communications: Clear, understandable performance explanations for end clients
    • Advisor Support: Detailed attribution analysis supporting advisor client conversations

    Future Outlook and Emerging Trends

    Technology Evolution

    Artificial Intelligence Integration

    • Predictive Benchmarking: AI-powered benchmark construction based on forward-looking factors
    • Dynamic Rebalancing: Automated benchmark adjustments based on changing market conditions
    • Natural Language Processing: AI-generated performance explanations in plain English

    Blockchain and DLT Applications

    • Performance Verification: Immutable performance records using distributed ledger technology
    • Smart Contract Automation: Automated performance fee calculations and distributions
    • Cross-Platform Integration: Seamless performance data sharing across multiple platforms

    Regulatory Evolution

    Enhanced Transparency Requirements

    • Performance Disclosure Expansion: Broader requirements for performance information disclosure
    • ESG Reporting Mandates: Mandatory sustainability performance reporting
    • Client Protection Enhancements: Stronger requirements for performance presentation standards

    Market Structure Changes

    Alternative Investment Mainstreaming

    • Private Market Integration: Improved benchmarking methodologies for private investments
    • Cryptocurrency Inclusion: Development of benchmarks incorporating digital assets
    • Factor-Based Evolution: Continued evolution toward factor-based benchmarking approaches

    Conclusion and Summary

    Portfolio performance benchmarking in 2025 represents a sophisticated, multi-dimensional discipline that extends far beyond simple return comparisons. The research reveals several critical insights:

    Scale and Complexity: With global AUM reaching $126 trillion and technology investment surging across the industry, benchmarking has become a central component of investment management infrastructure rather than a peripheral activity.

    Technology Integration: The adoption of AI and advanced analytics is transforming benchmarking from reactive analysis to predictive intelligence, with 41% of advisors already using AI tools and 65% planning technology upgrades.

    Regulatory Evolution: Enhanced standards from GIPS, ILPA, and regulatory bodies are driving greater standardization and transparency in performance measurement methodologies.

    ESG Integration: With ESG assets approaching 50% of professionally managed investments, sustainability benchmarking has become essential rather than optional.

    Multi-Dimensional Framework: Best practices emphasize comprehensive frameworks incorporating policy benchmarks, risk-adjusted metrics, attribution analysis, and peer comparisons rather than single-point solutions.

    ETNA Platform Advantage: Advanced platforms like ETNA provide the integrated technology infrastructure necessary to implement sophisticated benchmarking frameworks while maintaining user accessibility and regulatory compliance.

    The future of portfolio benchmarking lies in the seamless integration of advanced analytics, regulatory compliance, and client communication within unified technology platforms. Organizations that master this integration will provide superior investment outcomes and client experiences, while those relying on legacy approaches will face increasing competitive disadvantages.

    For wealth management professionals, the imperative is clear: embrace comprehensive benchmarking frameworks supported by advanced technology platforms, maintain rigorous governance standards, and continuously evolve practices to meet changing regulatory and client expectations. The firms that excel in these areas will define the leaders in wealth management for the decade ahead.

    Explore our platforms with
    web and mobile demos

    Financial Advisor Software
    Advanced Trading Platform
    Paper Trading Platform

    Demo Financial Advisor Software

    Manage portfolios with advanced rebalancing and real-time insights.

    Access customizable client reports and streamlined compliance tools.

    Designed for advisors seeking efficient client and portfolio management.

    Try Web Demo
    image

    Demo Advanced Trading Platform

    Test multi-asset strategies with real-time and historical data.

    Analyze market depth, execute complex options, and algorithmic orders.

    Ideal for refining strategies and risk management before live trading.

    Try Web Demo
    image

    Demo Paper Trading Platform

    Practice trading with virtual funds in real market conditions.

    Simulate cash, margin, and day-trader accounts to gain experience.

    Perfect for honing skills in a risk-free, customizable environment.

    Try Web Demo
    image
    Book a Demo Free Simulator